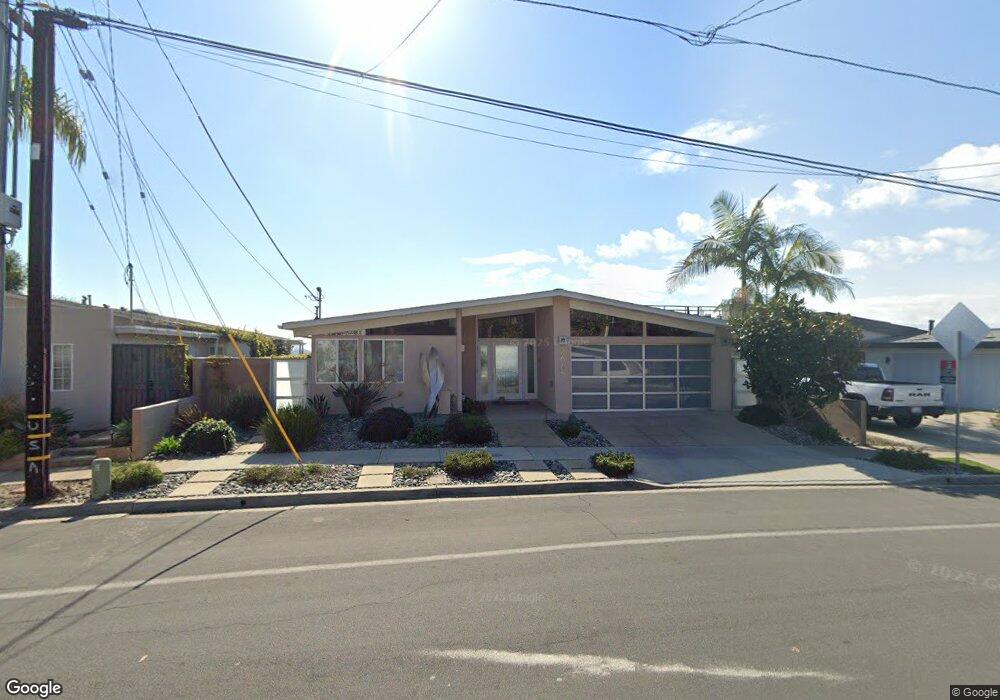
2645 Loring St San Diego, CA 92109
Pacific Beach NeighborhoodEstimated Value: $1,787,878 - $2,427,000
4
Beds
2
Baths
1,792
Sq Ft
$1,158/Sq Ft
Est. Value
About This Home
This home is located at 2645 Loring St, San Diego, CA 92109 and is currently estimated at $2,074,970, approximately $1,157 per square foot. 2645 Loring St is a home located in San Diego County with nearby schools including Sessions Elementary School, Pacific Beach Middle, and Mission Bay High School.
Ownership History
Date
Name
Owned For
Owner Type
Purchase Details
Closed on
Nov 18, 2016
Sold by
Moore Georgia and Moore Edward R
Bought by
Moore Edward R and Moore Georgia F
Current Estimated Value
Purchase Details
Closed on
Dec 28, 2009
Sold by
Post Gregory A
Bought by
Moore Georgia and Moore Edward R
Purchase Details
Closed on
Dec 19, 2001
Sold by
Post Elizabeth T
Bought by
Post Elizabeth T
Create a Home Valuation Report for This Property
The Home Valuation Report is an in-depth analysis detailing your home's value as well as a comparison with similar homes in the area
Home Values in the Area
Average Home Value in this Area
Purchase History
| Date | Buyer | Sale Price | Title Company |
|---|---|---|---|
| Moore Edward R | -- | None Available | |
| Moore Georgia | $955,000 | Advantage Title Inc | |
| Post Elizabeth T | -- | -- |
Source: Public Records
Tax History
| Year | Tax Paid | Tax Assessment Tax Assessment Total Assessment is a certain percentage of the fair market value that is determined by local assessors to be the total taxable value of land and additions on the property. | Land | Improvement |
|---|---|---|---|---|
| 2025 | $14,791 | $1,232,711 | $1,032,643 | $200,068 |
| 2024 | $14,791 | $1,208,542 | $1,012,396 | $196,146 |
| 2023 | $14,463 | $1,184,846 | $992,546 | $192,300 |
| 2022 | $14,077 | $1,161,615 | $973,085 | $188,530 |
| 2021 | $13,979 | $1,138,839 | $954,005 | $184,834 |
| 2020 | $13,809 | $1,127,162 | $944,223 | $182,939 |
| 2019 | $13,561 | $1,105,061 | $925,709 | $179,352 |
| 2018 | $12,676 | $1,083,394 | $907,558 | $175,836 |
| 2017 | $12,373 | $1,062,152 | $889,763 | $172,389 |
| 2016 | $12,176 | $1,041,326 | $872,317 | $169,009 |
| 2015 | $11,995 | $1,025,685 | $859,214 | $166,471 |
| 2014 | $11,804 | $1,005,595 | $842,384 | $163,211 |
Source: Public Records
Map
Nearby Homes
- 4985 Pacifica Dr
- 4909 Pacifica Dr
- 2561 Loring St
- 2526 Aster St
- 4829 Bella Pacific Row Unit 116
- 2481 La Marque St
- 2605 Pico Place Unit 215
- 4060 Huerfano Ave Unit 143
- 4060 Huerfano Ave
- 4060 Huerfano Ave Unit 130
- 4099 Huerfano Ave Unit 124
- 2603 Figueroa Blvd
- 4875 Academy St
- 4823-21 Academy (Lot 17)
- 4813 Academy St
- 4801 Academy St
- 4750 Noyes St Unit 204
- 4750 Noyes St Unit 218
- 2105 Harbour Heights Rd
- 4210 Moraga Ave
- 2635 Loring St
- 2655 Loring St
- 2625 Loring St
- 4950 Pacifica Dr
- 2665 Loring St
- 4946 Pacifica Dr
- 2648 Loring St
- 2638 Loring St
- 4988 Pacifica Dr
- 4942 Pacifica Dr
- 2615 Loring St
- 4954 Pacifica Dr
- 2628 Loring St
- 5004 Pacifica Dr
- 4962 Pacifica Dr
- 4938 Pacifica Dr
- 4980 Pacifica Dr
- 2616 Loring St
- 2605 Loring St Unit L107
- 5008 Pacifica Dr
Your Personal Tour Guide
Ask me questions while you tour the home.