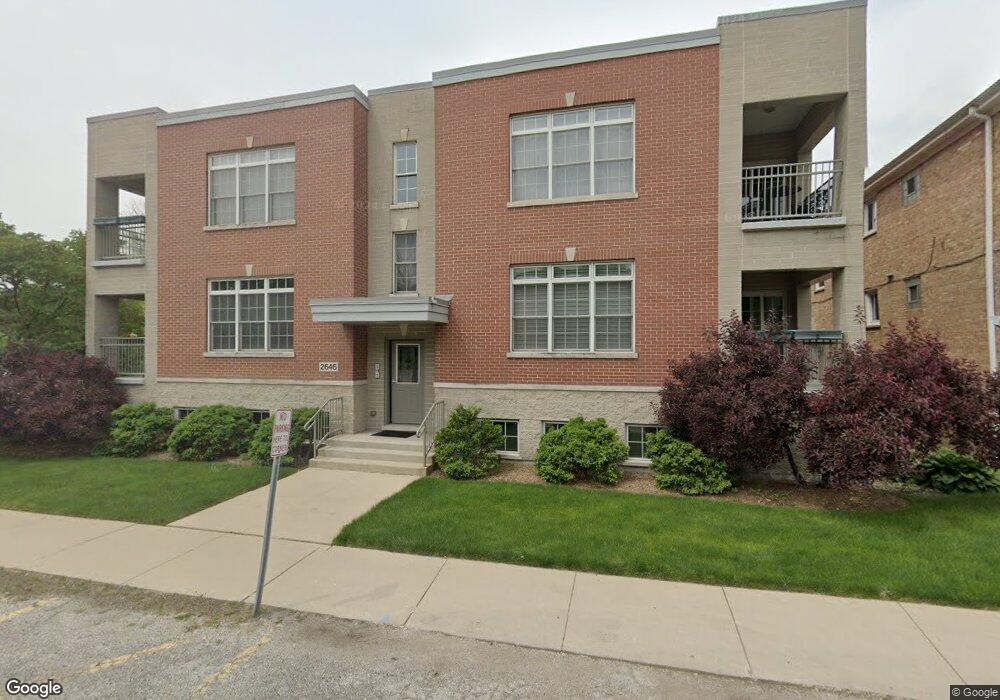
2646 Desplaines Ave Unit 2S Riverside, IL 60546
Estimated Value: $245,000 - $291,000
2
Beds
1
Bath
1,035
Sq Ft
$263/Sq Ft
Est. Value
About This Home
This home is located at 2646 Desplaines Ave Unit 2S, Riverside, IL 60546 and is currently estimated at $272,711, approximately $263 per square foot. 2646 Desplaines Ave Unit 2S is a home located in Cook County with nearby schools including A F Ames Elementary School, L J Hauser Jr High School, and Riverside Brookfield High School.
Ownership History
Date
Name
Owned For
Owner Type
Purchase Details
Closed on
Jul 14, 2024
Sold by
Morfin Javier and Wojciechowski Molly
Bought by
Hefner David N
Current Estimated Value
Home Financials for this Owner
Home Financials are based on the most recent Mortgage that was taken out on this home.
Original Mortgage
$11,200
Interest Rate
6.78%
Purchase Details
Closed on
Jun 8, 2021
Sold by
Liszek Mary Jo and Mary Jo Liszek Living Trust
Bought by
Morfin Javier and Wojciechowski Molly
Home Financials for this Owner
Home Financials are based on the most recent Mortgage that was taken out on this home.
Original Mortgage
$184,000
Interest Rate
2.99%
Mortgage Type
New Conventional
Purchase Details
Closed on
May 29, 2008
Sold by
Liszek Mary Jo
Bought by
Liszek Mary Jo and The Mary Jo Liszek Living Trust
Purchase Details
Closed on
May 17, 2007
Sold by
Wright Development Corp
Bought by
Liszek Mary Jo
Create a Home Valuation Report for This Property
The Home Valuation Report is an in-depth analysis detailing your home's value as well as a comparison with similar homes in the area
Home Values in the Area
Average Home Value in this Area
Purchase History
| Date | Buyer | Sale Price | Title Company |
|---|---|---|---|
| Hefner David N | $280,000 | None Listed On Document | |
| Hefner David N | $280,000 | None Listed On Document | |
| Morfin Javier | $230,000 | Chicago Title | |
| Morfin Javier | $230,000 | Chicago Title | |
| Liszek Mary Jo | -- | None Available | |
| Liszek Mary Jo | -- | None Available | |
| Liszek Mary Jo | $330,000 | First American Title | |
| Liszek Mary Jo | $330,000 | First American Title |
Source: Public Records
Mortgage History
| Date | Status | Borrower | Loan Amount |
|---|---|---|---|
| Closed | Hefner David N | $11,200 | |
| Previous Owner | Hefner David N | $224,000 | |
| Previous Owner | Morfin Javier | $184,000 |
Source: Public Records
Tax History
| Year | Tax Paid | Tax Assessment Tax Assessment Total Assessment is a certain percentage of the fair market value that is determined by local assessors to be the total taxable value of land and additions on the property. | Land | Improvement |
|---|---|---|---|---|
| 2025 | $5,318 | $19,108 | $2,002 | $17,106 |
| 2024 | $5,318 | $19,108 | $2,002 | $17,106 |
| 2023 | $6,090 | $19,108 | $2,002 | $17,106 |
| 2022 | $6,090 | $18,332 | $1,852 | $16,480 |
| 2021 | $4,795 | $18,331 | $1,852 | $16,479 |
| 2020 | $4,720 | $18,331 | $1,852 | $16,479 |
| 2019 | $5,647 | $22,000 | $1,702 | $20,298 |
| 2018 | $5,483 | $22,000 | $1,702 | $20,298 |
| 2017 | $5,352 | $22,000 | $1,702 | $20,298 |
| 2016 | $5,369 | $20,152 | $1,401 | $18,751 |
| 2015 | $5,194 | $20,152 | $1,401 | $18,751 |
| 2014 | $5,208 | $20,152 | $1,401 | $18,751 |
| 2013 | $6,287 | $25,519 | $1,401 | $24,118 |
Source: Public Records
Map
Nearby Homes
- 2527 Keystone Ave
- 2433 Keystone Ave
- 315 Bartram Rd
- 305 Desplaines Ave
- 8117 W 30th St
- 472 Northgate Ct
- 2245 Des Plaines Ave Unit A
- 2311 Park Ave
- 2233 Des Plaines Ave
- 2230 Keystone Ave
- 236 Maplewood Rd
- 220 Maplewood Rd
- 2522 S 3rd Ave
- 2252 Northgate Ave
- 269 Shenstone Rd
- 339 Eastgrove Rd
- 562 Byrd Rd
- 10 E Burlington St Unit 2C
- 10 E Burlington St Unit 2B
- 78 Pine Ave
- 2646 Desplaines Ave Unit 2N
- 2646 Desplaines Ave Unit 1N
- 2646 Des Plaines Ave Unit 2S
- 2646 Des Plaines Ave Unit 2N
- 2640 Des Plaines Ave
- 2636 Des Plaines Ave
- 8012 W 27th St
- 2628 Desplaines Ave
- 2628 Desplaines Ave Unit 1S
- 8014 W 27th St
- 8016 W 27th St
- 453 Desplaines Ave
- 8018 W 27th St
- 413 Desplaines Ave
- 8020 W 27th St
- 412 Bartram Rd
- 8011 W 26th St
- 14 Northgate Rd
- 405 Desplaines Ave
- 405 Desplaines Ave
Your Personal Tour Guide
Ask me questions while you tour the home.