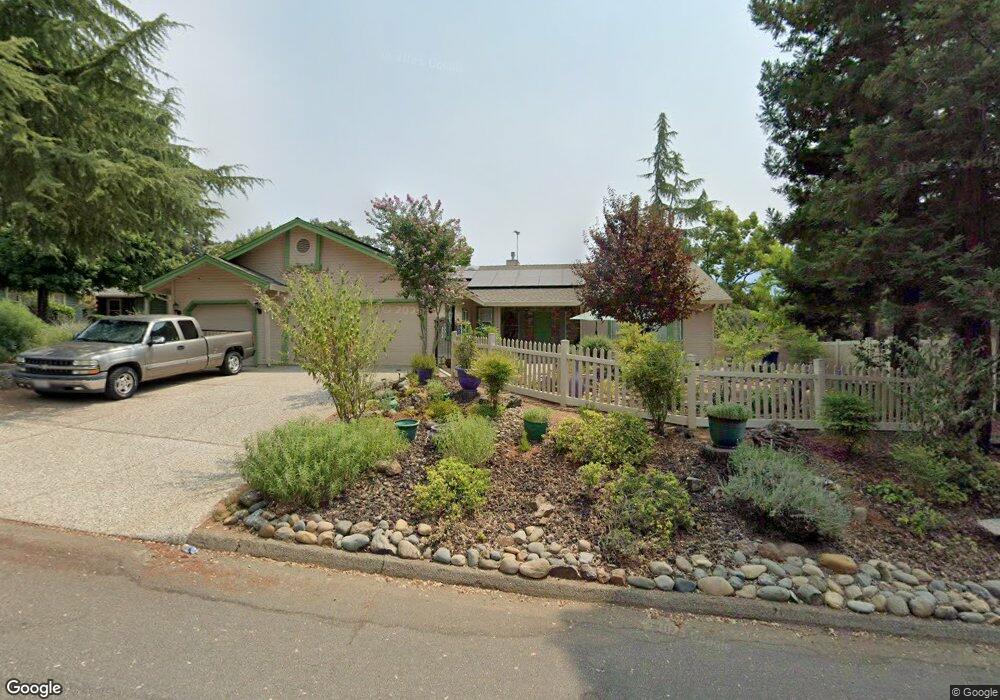
2647 Tudor Ct Rescue, CA 95672
Estimated Value: $287,000 - $653,000
3
Beds
2
Baths
1,942
Sq Ft
$280/Sq Ft
Est. Value
About This Home
This home is located at 2647 Tudor Ct, Rescue, CA 95672 and is currently estimated at $544,547, approximately $280 per square foot. 2647 Tudor Ct is a home located in El Dorado County with nearby schools including Rescue Elementary School, Pleasant Grove Middle School, and Ponderosa High School.
Ownership History
Date
Name
Owned For
Owner Type
Purchase Details
Closed on
Mar 22, 2011
Sold by
Patterson Arthur Spencer and Brown Judith M
Bought by
Borgman Dale and Borgman Mary
Current Estimated Value
Purchase Details
Closed on
Jul 27, 2006
Sold by
Patterson Art and Brown Judy
Bought by
Patterson Arthur Spencer and Brown Judith M
Purchase Details
Closed on
Jun 13, 2003
Sold by
Lacasse Raymond A
Bought by
Patterson Art and Brown Judy
Purchase Details
Closed on
Feb 12, 1997
Sold by
Niderost Natasha L
Bought by
Lacasse Raymond A and Lacasse Edith E
Home Financials for this Owner
Home Financials are based on the most recent Mortgage that was taken out on this home.
Original Mortgage
$115,000
Interest Rate
7.85%
Purchase Details
Closed on
Sep 8, 1995
Sold by
Su Yueh Liu
Bought by
Niderost Natasha L
Create a Home Valuation Report for This Property
The Home Valuation Report is an in-depth analysis detailing your home's value as well as a comparison with similar homes in the area
Home Values in the Area
Average Home Value in this Area
Purchase History
| Date | Buyer | Sale Price | Title Company |
|---|---|---|---|
| Borgman Dale | $270,000 | Commerce Title Company | |
| Patterson Arthur Spencer | -- | None Available | |
| Patterson Art | -- | None Available | |
| Patterson Art | $320,000 | First American Title Co | |
| Lacasse Raymond A | $182,500 | Fidelity National Title Co | |
| Niderost Natasha L | -- | -- |
Source: Public Records
Mortgage History
| Date | Status | Borrower | Loan Amount |
|---|---|---|---|
| Previous Owner | Lacasse Raymond A | $115,000 |
Source: Public Records
Tax History
| Year | Tax Paid | Tax Assessment Tax Assessment Total Assessment is a certain percentage of the fair market value that is determined by local assessors to be the total taxable value of land and additions on the property. | Land | Improvement |
|---|---|---|---|---|
| 2025 | $3,635 | $345,899 | $96,078 | $249,821 |
| 2024 | $3,635 | $339,118 | $94,195 | $244,923 |
| 2023 | $3,569 | $332,470 | $92,349 | $240,121 |
| 2022 | $3,521 | $325,952 | $90,539 | $235,413 |
| 2021 | $3,479 | $319,562 | $88,764 | $230,798 |
| 2020 | $3,431 | $316,286 | $87,854 | $228,432 |
| 2019 | $3,371 | $310,085 | $86,132 | $223,953 |
| 2018 | $3,277 | $304,006 | $84,444 | $219,562 |
| 2017 | $3,216 | $298,046 | $82,789 | $215,257 |
| 2016 | $3,179 | $292,203 | $81,166 | $211,037 |
| 2015 | $3,069 | $287,816 | $79,948 | $207,868 |
| 2014 | $3,069 | $282,181 | $78,383 | $203,798 |
Source: Public Records
Map
Nearby Homes
- 2401 Cold Harbor Way
- 2537 Chesapeake Bay Cir
- 2681 Cameron Park Dr Unit 155
- 2681 Cameron Park Dr Unit 54
- 2681 Cameron Park Dr Unit 146
- 2681 Cameron Park Dr Unit 47
- 2681 Cameron Park Dr Unit 170
- 2681 Cameron Park Dr Unit 145
- 2681 Cameron Park Dr Unit 132
- 3363 Cimmarron Rd
- 0 La Crescenta Dr Unit 226003940
- 3281 La Canada Dr
- 3381 La Canada Dr Unit 8
- 3394 La Canada Dr
- 2435 Sandpiper Way
- 2628 Royal Park Dr
- 4446 Fremonts Loop
- 3369 Melodye Ct
- 2797 Alhambra Dr
- 2805 Alhambra Dr
- 2641 Tudor Ct
- 2932 Fulam Ct
- 2926 Fulam Ct
- 2639 Tudor Ct
- 2646 Tudor Ct
- 2922 Fulam Ct
- 2638 Tudor Ct
- 2640 Tudor Ct
- 2920 Fulam Ct
- 2931 Fulam Ct
- 2461 Starbuck Rd
- 2545 Hastings Dr
- 2509 Starbuck Rd
- 2923 Fulam Ct
- 2451 Starbuck Rd
- 2921 Fulam Ct
- 2988 Windsor Ct
- 2470 Starbuck Rd
- 2559 Hastings Dr
- 2520 Starbuck Rd
Your Personal Tour Guide
Ask me questions while you tour the home.