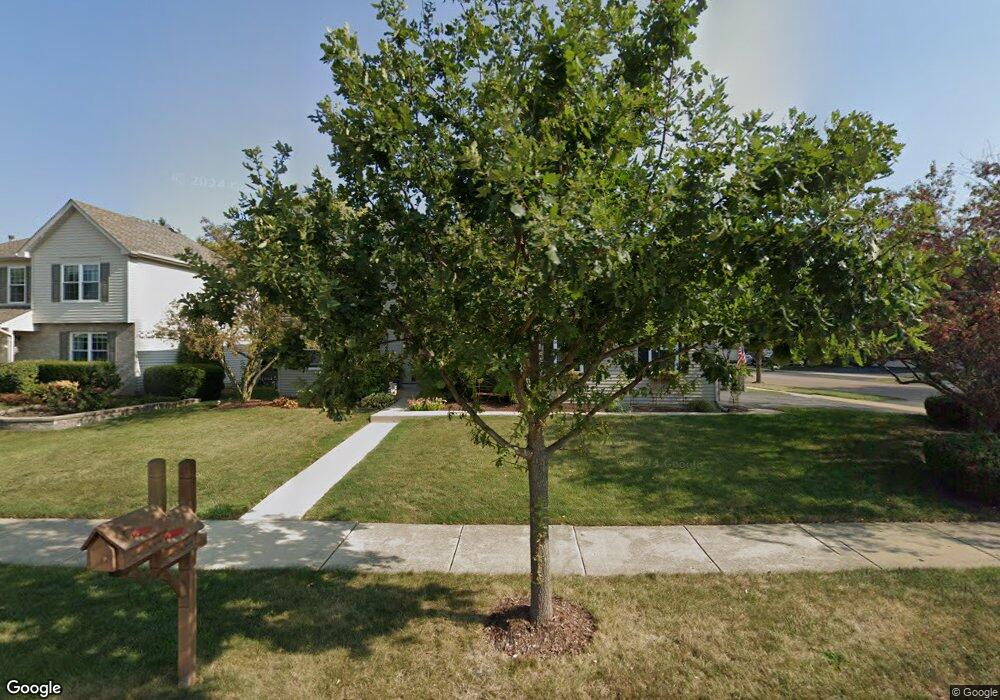
2648 Crestview Dr Aurora, IL 60502
Eola Yards NeighborhoodEstimated Value: $496,000 - $594,000
4
Beds
3
Baths
2,297
Sq Ft
$245/Sq Ft
Est. Value
About This Home
This home is located at 2648 Crestview Dr, Aurora, IL 60502 and is currently estimated at $563,362, approximately $245 per square foot. 2648 Crestview Dr is a home located in DuPage County with nearby schools including Nancy Young Elementary School, Francis Granger Middle School, and Metea Valley High School.
Ownership History
Date
Name
Owned For
Owner Type
Purchase Details
Closed on
Oct 16, 2018
Sold by
Mcsharry James D and Mcsharry Lisa D
Bought by
Mcsharry James D and Mcsharry Lisa D
Current Estimated Value
Purchase Details
Closed on
Mar 31, 2000
Sold by
Lukes William C and Lukes Judith L
Bought by
Mcsharry James D and Mcsharry Lisa D
Home Financials for this Owner
Home Financials are based on the most recent Mortgage that was taken out on this home.
Original Mortgage
$150,000
Outstanding Balance
$51,685
Interest Rate
8.31%
Estimated Equity
$511,677
Purchase Details
Closed on
Jul 30, 1998
Sold by
Kings Court Builders Inc
Bought by
Lukes William C and Lukes Judith L
Home Financials for this Owner
Home Financials are based on the most recent Mortgage that was taken out on this home.
Original Mortgage
$169,150
Interest Rate
7.05%
Purchase Details
Closed on
Sep 25, 1997
Sold by
La Salle National Bank
Bought by
Kings Court Builders Inc
Home Financials for this Owner
Home Financials are based on the most recent Mortgage that was taken out on this home.
Original Mortgage
$650,000
Interest Rate
7.65%
Create a Home Valuation Report for This Property
The Home Valuation Report is an in-depth analysis detailing your home's value as well as a comparison with similar homes in the area
Home Values in the Area
Average Home Value in this Area
Purchase History
| Date | Buyer | Sale Price | Title Company |
|---|---|---|---|
| Mcsharry James D | -- | Attorney | |
| Mcsharry James D | $230,500 | Wheatland Title | |
| Lukes William C | $210,500 | -- | |
| Kings Court Builders Inc | $584,500 | -- |
Source: Public Records
Mortgage History
| Date | Status | Borrower | Loan Amount |
|---|---|---|---|
| Open | Mcsharry James D | $150,000 | |
| Previous Owner | Lukes William C | $169,150 | |
| Previous Owner | Kings Court Builders Inc | $650,000 |
Source: Public Records
Tax History
| Year | Tax Paid | Tax Assessment Tax Assessment Total Assessment is a certain percentage of the fair market value that is determined by local assessors to be the total taxable value of land and additions on the property. | Land | Improvement |
|---|---|---|---|---|
| 2024 | $11,541 | $159,790 | $37,349 | $122,441 |
| 2023 | $11,018 | $143,580 | $33,560 | $110,020 |
| 2022 | $10,421 | $130,270 | $30,200 | $100,070 |
| 2021 | $10,148 | $125,620 | $29,120 | $96,500 |
| 2020 | $10,272 | $125,620 | $29,120 | $96,500 |
| 2019 | $9,913 | $119,480 | $27,700 | $91,780 |
| 2018 | $9,784 | $116,770 | $26,860 | $89,910 |
| 2017 | $9,623 | $112,810 | $25,950 | $86,860 |
| 2016 | $9,455 | $108,260 | $24,900 | $83,360 |
| 2015 | $9,363 | $102,790 | $23,640 | $79,150 |
| 2014 | $8,682 | $93,140 | $21,260 | $71,880 |
| 2013 | $8,593 | $93,790 | $21,410 | $72,380 |
Source: Public Records
Map
Nearby Homes
- 1078 Parkhill Cir
- 1015 Woodview Ct
- 931 Preserve Ct Unit 2004
- 929 Preserve Ct Unit 2005
- 1048 Asbury Dr
- 530 Wolverine Dr
- 940 Burnham Ct
- 452 Jamestown Ct Unit 506
- 369 Vaughn Cir
- 2321 Hudson Cir Unit 2701
- 970 Waterside Ct
- 2333 Stoughton Cir Unit 350206
- 322 4th St
- 1110 Oakhill Dr
- 255 Vaughn Rd
- 253 Vaughn Rd
- 251 Vaughn Rd
- 249 Vaughn Rd
- 229 Vaughn Rd
- 530 Conservatory Ln
- 2638 Crestview Dr
- 904 Asbury Dr
- 2628 Crestview Dr
- 909 Asbury Dr
- 905 Asbury Dr Unit 54
- 901 Asbury Dr
- 905 Asbury Dr
- 903 Asbury Dr
- 911 Asbury Dr
- 908 Asbury Dr
- 871 Asbury Dr
- 875 Asbury Dr
- 877 Asbury Dr
- 873 Asbury Dr Unit 4873
- 2608 Crestview Dr
- 2618 Crestview Dr
- 912 Asbury Dr
- 853 Asbury Dr
- 855 Asbury Dr
- 857 Asbury Dr
Your Personal Tour Guide
Ask me questions while you tour the home.