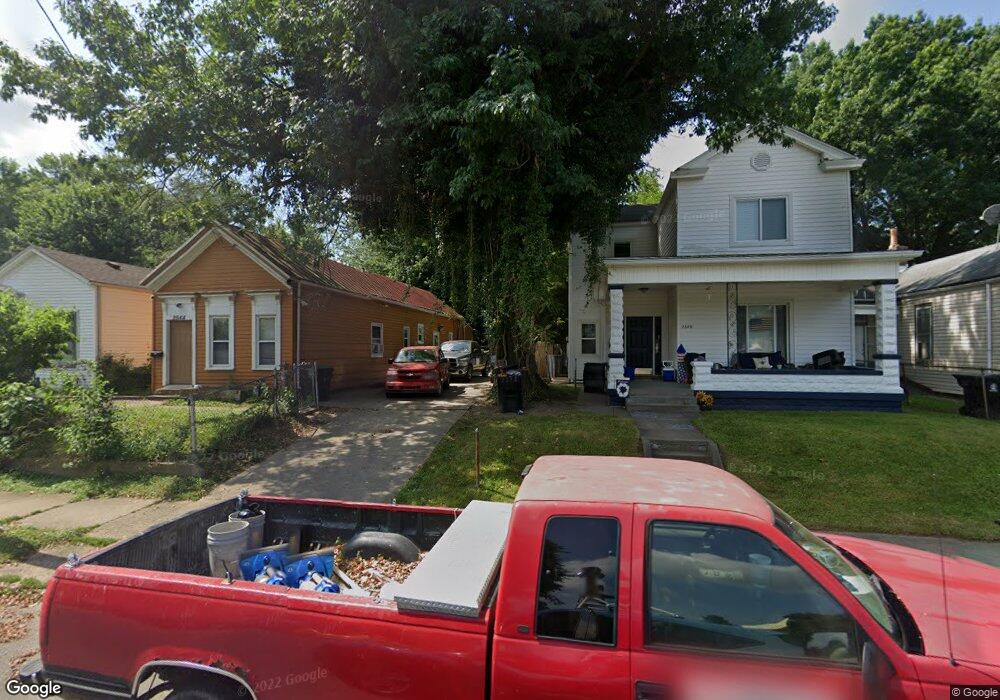
2648 Duncan St Louisville, KY 40212
Portland NeighborhoodEstimated Value: $97,000 - $140,000
2
Beds
2
Baths
1,576
Sq Ft
$77/Sq Ft
Est. Value
About This Home
This home is located at 2648 Duncan St, Louisville, KY 40212 and is currently estimated at $121,013, approximately $76 per square foot. 2648 Duncan St is a home located in Jefferson County with nearby schools including Middletown Elementary School, Greathouse Shryock Traditional Elementary School, and Bowen Elementary School.
Ownership History
Date
Name
Owned For
Owner Type
Purchase Details
Closed on
Jun 2, 2014
Sold by
Paramount Portoflio Management Llc
Bought by
Laurel Homes Llc
Current Estimated Value
Purchase Details
Closed on
Oct 20, 2011
Sold by
Thor Real Estate Llc
Bought by
Hoops Llc
Purchase Details
Closed on
Apr 7, 2011
Sold by
Home Servicing Llc
Bought by
Thor Real Estate Llc
Purchase Details
Closed on
Sep 30, 2009
Sold by
Home Servicing Llc
Bought by
Paramount Portfolio Management Llc
Purchase Details
Closed on
May 17, 2007
Sold by
Pledged Property Ii Llc
Bought by
Home Servicing Llc
Create a Home Valuation Report for This Property
The Home Valuation Report is an in-depth analysis detailing your home's value as well as a comparison with similar homes in the area
Home Values in the Area
Average Home Value in this Area
Purchase History
| Date | Buyer | Sale Price | Title Company |
|---|---|---|---|
| Laurel Homes Llc | $8,124 | None Available | |
| Hoops Llc | $5,000 | None Available | |
| Thor Real Estate Llc | -- | Brb Trust Title Company | |
| Paramount Portfolio Management Llc | $8,765 | None Available | |
| Home Servicing Llc | -- | None Available |
Source: Public Records
Tax History Compared to Growth
Tax History
| Year | Tax Paid | Tax Assessment Tax Assessment Total Assessment is a certain percentage of the fair market value that is determined by local assessors to be the total taxable value of land and additions on the property. | Land | Improvement |
|---|---|---|---|---|
| 2024 | $730 | $56,830 | $5,300 | $51,530 |
| 2023 | $763 | $56,830 | $5,300 | $51,530 |
| 2022 | $718 | $52,800 | $3,000 | $49,800 |
| 2021 | $765 | $52,800 | $3,000 | $49,800 |
| 2020 | $726 | $52,800 | $3,000 | $49,800 |
| 2019 | $708 | $52,800 | $3,000 | $49,800 |
| 2018 | $439 | $33,160 | $2,500 | $30,660 |
| 2017 | $432 | $33,160 | $2,500 | $30,660 |
| 2013 | $332 | $33,160 | $2,500 | $30,660 |
Source: Public Records
Map
Nearby Homes