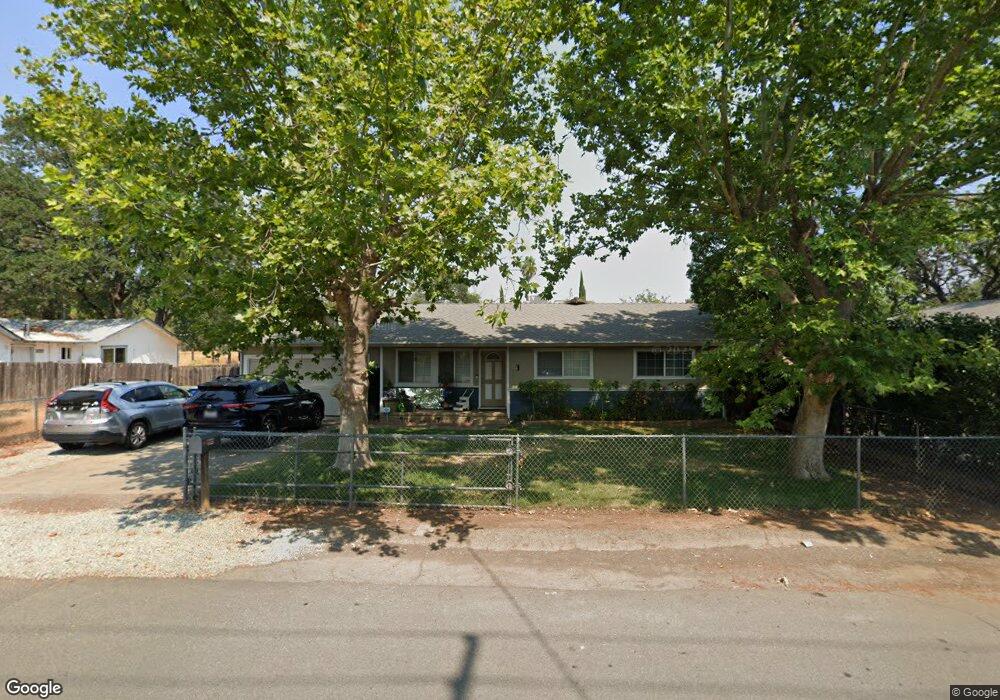
2649 Irwin Rd Redding, CA 96002
Reservoir NeighborhoodEstimated Value: $287,000 - $711,000
3
Beds
2
Baths
1,560
Sq Ft
$264/Sq Ft
Est. Value
About This Home
This home is located at 2649 Irwin Rd, Redding, CA 96002 and is currently estimated at $411,565, approximately $263 per square foot. 2649 Irwin Rd is a home located in Shasta County with nearby schools including Rother Elementary School, Parsons Junior High School, and Enterprise High School.
Ownership History
Date
Name
Owned For
Owner Type
Purchase Details
Closed on
Feb 23, 2016
Sold by
Dickens Lawrence and Dickens Wendy Sue
Bought by
Dickens Wendy S
Current Estimated Value
Home Financials for this Owner
Home Financials are based on the most recent Mortgage that was taken out on this home.
Original Mortgage
$162,850
Outstanding Balance
$129,695
Interest Rate
3.92%
Mortgage Type
FHA
Estimated Equity
$281,870
Purchase Details
Closed on
Oct 24, 2002
Sold by
Silveira Mark and Silveira Janis
Bought by
Dickens Lawrence and Dickens Wendy Sue
Home Financials for this Owner
Home Financials are based on the most recent Mortgage that was taken out on this home.
Original Mortgage
$132,914
Interest Rate
5.99%
Mortgage Type
FHA
Purchase Details
Closed on
Dec 31, 2001
Sold by
Saelee Liew Chow and Saelee San Kuan
Bought by
Silveira Mark and Silveira Janis
Create a Home Valuation Report for This Property
The Home Valuation Report is an in-depth analysis detailing your home's value as well as a comparison with similar homes in the area
Home Values in the Area
Average Home Value in this Area
Purchase History
| Date | Buyer | Sale Price | Title Company |
|---|---|---|---|
| Dickens Wendy S | -- | Fidelity Natl Title Co Of Ca | |
| Dickens Lawrence | $135,000 | Alliance Title Company | |
| Silveira Mark | $64,705 | Alliance Title Company |
Source: Public Records
Mortgage History
| Date | Status | Borrower | Loan Amount |
|---|---|---|---|
| Open | Dickens Wendy S | $162,850 | |
| Closed | Dickens Lawrence | $132,914 |
Source: Public Records
Tax History
| Year | Tax Paid | Tax Assessment Tax Assessment Total Assessment is a certain percentage of the fair market value that is determined by local assessors to be the total taxable value of land and additions on the property. | Land | Improvement |
|---|---|---|---|---|
| 2025 | $2,061 | $195,501 | $43,438 | $152,063 |
| 2024 | $2,031 | $191,669 | $42,587 | $149,082 |
| 2023 | $2,031 | $187,911 | $41,752 | $146,159 |
| 2022 | $1,972 | $184,228 | $40,934 | $143,294 |
| 2021 | $1,904 | $180,617 | $40,132 | $140,485 |
| 2020 | $1,894 | $178,766 | $39,721 | $139,045 |
| 2019 | $1,878 | $175,262 | $38,943 | $136,319 |
| 2018 | $1,854 | $171,827 | $38,180 | $133,647 |
| 2017 | $1,885 | $168,459 | $37,432 | $131,027 |
| 2016 | $1,763 | $165,157 | $36,699 | $128,458 |
| 2015 | $1,747 | $162,677 | $36,148 | $126,529 |
| 2014 | $1,672 | $154,000 | $30,000 | $124,000 |
Source: Public Records
Map
Nearby Homes
- 2631 Alfreda Way
- 2583 Reservoir Ln
- 2820 Alfreda Way
- 2855 Irwin Rd
- 2893 Alfreda Way
- 2906 Regal Ave
- 1701 E Cypress Ave
- 0 Churn Creek Rd Unit 25-496
- 0 Churn Creek Rd Unit 26-609
- 3178 Lawrence Rd
- 890 Parsons Dr
- 2976 West Way
- 3283 Middleton Ln
- 1075 Le Brun Ln
- 1005 Grissom Ct
- 1890 Manchester Dr
- 3087 Northwoods Way
- 1091 Del Sol Place
- 3293 Middleton Ln
- 1953 Cameo Ct
- 2663 Irwin Rd
- 2642 Reservoir Ln
- 2644 Reservoir Ln
- 2681 Irwin Rd
- 2646 Reservoir Ln
- 2634 Reservoir Ln
- 2650 Irwin Rd
- 2660 Irwin Rd
- 2621 Irwin Rd
- 2630 Irwin Rd
- 2680 Reservoir Ln
- 2680 Irwin Rd
- 2707 Irwin Rd
- 2620 Irwin Rd
- 2690 Reservoir Ln
- 2711 Irwin Rd
- 2711 Irwin Rd
- 2706 Irwin Rd
- 2610 Reservoir Ln
- 2610 Irwin Rd
Your Personal Tour Guide
Ask me questions while you tour the home.