2649 Knightsbridge Rd SE Grand Rapids, MI 49546
Estimated Value: $215,000 - $241,725
2
Beds
3
Baths
1
Sq Ft
$225,931/Sq Ft
Est. Value
About This Home
This home is located at 2649 Knightsbridge Rd SE, Grand Rapids, MI 49546 and is currently estimated at $225,931, approximately $225,931 per square foot. 2649 Knightsbridge Rd SE is a home located in Kent County with nearby schools including Thornapple Elementary School, Central Woodlands 5/6 School, and Central Middle School.
Ownership History
Date
Name
Owned For
Owner Type
Purchase Details
Closed on
Jan 20, 2022
Sold by
Kibreab Beyene
Bought by
Pinupolu Venkata Subba Bhavya
Current Estimated Value
Purchase Details
Closed on
Jan 19, 2021
Sold by
Beyene Kibreab
Bought by
Beyene Kibreab and Asghedom Netzanet
Purchase Details
Closed on
May 16, 2018
Sold by
Patterson Terri
Bought by
Beyene Kibreab
Home Financials for this Owner
Home Financials are based on the most recent Mortgage that was taken out on this home.
Original Mortgage
$93,160
Interest Rate
4.4%
Mortgage Type
New Conventional
Purchase Details
Closed on
Aug 29, 2017
Sold by
Westdale Geneva
Bought by
Patterson Terri
Purchase Details
Closed on
Aug 27, 2015
Sold by
Westdale Geneva
Bought by
Budzeak Cheryl and Westdale Frederick
Purchase Details
Closed on
Nov 6, 1996
Sold by
Deboer Thomas P
Bought by
Westdale Geneva and Westdale Geneva F
Create a Home Valuation Report for This Property
The Home Valuation Report is an in-depth analysis detailing your home's value as well as a comparison with similar homes in the area
Home Values in the Area
Average Home Value in this Area
Purchase History
| Date | Buyer | Sale Price | Title Company |
|---|---|---|---|
| Pinupolu Venkata Subba Bhavya | $190,000 | Chicago Title | |
| Beyene Kibreab | -- | None Available | |
| Beyene Kibreab | $137,000 | None Available | |
| Patterson Terri | $128,000 | Grand Rapids Title | |
| Budzeak Cheryl | -- | Attorney | |
| Westdale Geneva | $79,100 | -- |
Source: Public Records
Mortgage History
| Date | Status | Borrower | Loan Amount |
|---|---|---|---|
| Previous Owner | Beyene Kibreab | $93,160 |
Source: Public Records
Tax History Compared to Growth
Tax History
| Year | Tax Paid | Tax Assessment Tax Assessment Total Assessment is a certain percentage of the fair market value that is determined by local assessors to be the total taxable value of land and additions on the property. | Land | Improvement |
|---|---|---|---|---|
| 2025 | $1,793 | $98,800 | $0 | $0 |
| 2024 | $1,793 | $89,300 | $0 | $0 |
| 2023 | $2,348 | $81,600 | $0 | $0 |
| 2022 | $1,935 | $76,500 | $0 | $0 |
| 2021 | $1,887 | $69,600 | $0 | $0 |
| 2020 | $1,275 | $64,400 | $0 | $0 |
| 2019 | $1,722 | $58,000 | $0 | $0 |
| 2018 | $1,722 | $52,700 | $0 | $0 |
| 2017 | $1,264 | $48,600 | $0 | $0 |
| 2016 | $1,220 | $44,000 | $0 | $0 |
| 2015 | -- | $44,000 | $0 | $0 |
| 2013 | -- | $38,800 | $0 | $0 |
Source: Public Records
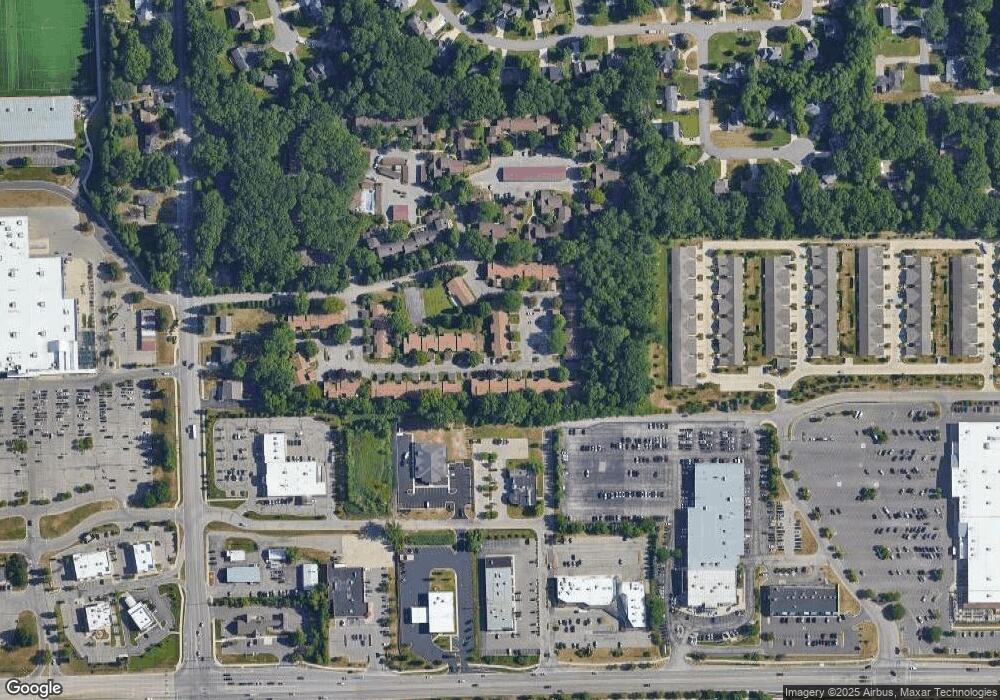
Map
Nearby Homes
- 2630 Chatham Woods Dr SE Unit 1
- 2594 Tall Timber Ct SE
- 2444 Irene Ave SE
- 3750 Charlevoix Dr SE
- 6334 Bechalla Dr SE
- 6249 Acropolis Dr SE
- 2546 Highridge Ln SE
- 3005 Chapshire Dr SE
- 2984 Chapshire Dr SE Unit 59
- 2242 Christine Ct SE
- 2462 Highridge Ln SE
- 6348 Greenway Dr SE Unit 62
- 1878 Watermark Dr SE
- 6587 Waybridge Dr SE
- 6716 Cascade Rd SE Unit 46
- 6260 Heathmoor Ct SE Unit 26
- 6657 Waybridge Dr SE
- 6663 Waybridge Dr SE Unit 37
- 6554 Round Hill Ct SE
- 6554 Round Hill Ct SE Unit Lot 7
- 2649 Knightsbridge Rd SE Unit 44
- 2647 Knightsbridge Rd SE Unit 43
- 2645 Knightsbridge Rd SE
- 2643 Knightsbridge Rd SE Unit 41
- 2685 Chatham Woods Dr SE Unit 49
- 2641 Knightsbridge Rd SE
- 2683 Chatham Woods Dr SE Unit 48
- 2681 Chatham Woods Dr SE
- 2687 Chatham Woods Dr SE
- 2687 Chatham Woods Dr SE Unit 50
- 2679 Chatham Woods Dr SE
- 2679 Chatham Woods Dr SE Unit 46
- 2689 Chatham Woods Dr SE Unit 51
- 2677 Chatham Woods Dr SE
- 2639 Knightsbridge Rd SE Unit 39
- 2691 Chatham Woods Dr SE
- 2691 Chatham Woods Dr SE Unit 52
- 2693 Chatham Woods Dr SE
- 2628 Knightsbridge Rd SE
- 2626 Knightsbridge Rd SE Unit 66