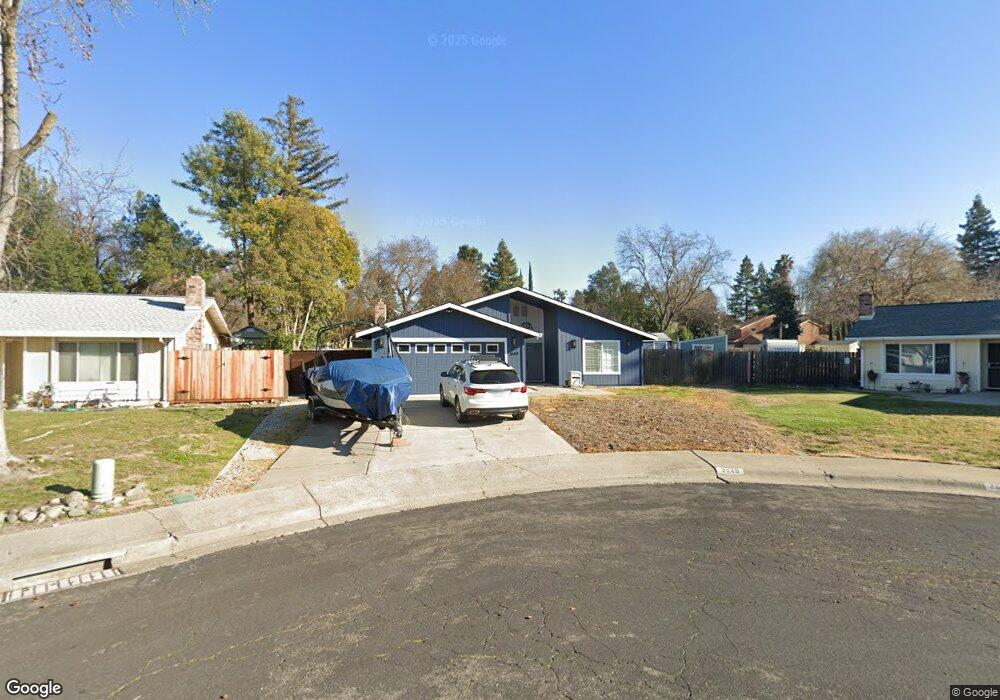
2649 Mandarin Ct West Sacramento, CA 95691
Southport NeighborhoodEstimated Value: $408,000 - $572,000
3
Beds
2
Baths
1,417
Sq Ft
$366/Sq Ft
Est. Value
About This Home
This home is located at 2649 Mandarin Ct, West Sacramento, CA 95691 and is currently estimated at $518,059, approximately $365 per square foot. 2649 Mandarin Ct is a home located in Yolo County with nearby schools including Southport Elementary School, River City High, and Our Lady Of Grace.
Ownership History
Date
Name
Owned For
Owner Type
Purchase Details
Closed on
Dec 30, 2020
Sold by
Soto Todd P
Bought by
Semeryuk Kristina and Semeryuk Anton
Current Estimated Value
Home Financials for this Owner
Home Financials are based on the most recent Mortgage that was taken out on this home.
Original Mortgage
$427,500
Outstanding Balance
$381,478
Interest Rate
2.7%
Mortgage Type
New Conventional
Estimated Equity
$136,581
Purchase Details
Closed on
Jul 28, 2017
Sold by
King King Linda Lea Linda Lea and King Robert Lee
Bought by
Soto Todd P
Home Financials for this Owner
Home Financials are based on the most recent Mortgage that was taken out on this home.
Original Mortgage
$363,750
Interest Rate
3.9%
Mortgage Type
New Conventional
Purchase Details
Closed on
Jun 30, 2014
Sold by
King Linda L and King Robert L
Bought by
Robert Lee King & Linda Lea King Family
Purchase Details
Closed on
Apr 10, 2005
Sold by
King Robert L and King Linda L
Bought by
King Robert L and King Linda L
Purchase Details
Closed on
Apr 1, 2005
Sold by
Va
Bought by
King Robert L and Mitchell Linda L
Create a Home Valuation Report for This Property
The Home Valuation Report is an in-depth analysis detailing your home's value as well as a comparison with similar homes in the area
Home Values in the Area
Average Home Value in this Area
Purchase History
| Date | Buyer | Sale Price | Title Company |
|---|---|---|---|
| Semeryuk Kristina | $450,000 | Placer Title Company | |
| Soto Todd P | $375,000 | Placer Title Co | |
| Robert Lee King & Linda Lea King Family | -- | None Available | |
| King Robert L | -- | -- | |
| King Robert L | -- | -- |
Source: Public Records
Mortgage History
| Date | Status | Borrower | Loan Amount |
|---|---|---|---|
| Open | Semeryuk Kristina | $427,500 | |
| Previous Owner | Soto Todd P | $363,750 |
Source: Public Records
Tax History Compared to Growth
Tax History
| Year | Tax Paid | Tax Assessment Tax Assessment Total Assessment is a certain percentage of the fair market value that is determined by local assessors to be the total taxable value of land and additions on the property. | Land | Improvement |
|---|---|---|---|---|
| 2025 | $5,842 | $487,091 | $129,890 | $357,201 |
| 2023 | $5,842 | $468,180 | $124,848 | $343,332 |
| 2022 | $5,447 | $459,000 | $122,400 | $336,600 |
| 2021 | $4,845 | $394,191 | $94,606 | $299,585 |
| 2020 | $4,619 | $390,150 | $93,636 | $296,514 |
| 2019 | $4,564 | $382,500 | $91,800 | $290,700 |
| 2018 | $4,479 | $375,000 | $90,000 | $285,000 |
| 2017 | $1,955 | $152,680 | $33,442 | $119,238 |
| 2016 | $1,927 | $149,687 | $32,787 | $116,900 |
| 2015 | $1,707 | $147,440 | $32,295 | $115,145 |
| 2014 | $1,707 | $144,553 | $31,663 | $112,890 |
Source: Public Records
Map
Nearby Homes
- 2669 Tyler Way
- 2586 Lagoon Ln
- 2857 Kimberly Ct
- 2586 Duet Dr
- 2556 Duet Dr
- 2617 Independence Ave
- 2893 Mergansers Ct
- 2896 Allan Ave
- 2960 Hart Ave
- 3016 Canvasback Way
- 324 Bridge Place
- 3065 Allan Ave
- 2975 Jefferson Blvd
- 32508 Jefferson Blvd
- 235 Touchstone Place
- 2972 Violet Dr
- 209 Touchstone Place
- 3175 Jefferson Blvd
- 0 Jefferson Blvd Unit 225119728
- 2881 Perez Ct
- 2645 Mandarin Ct
- 2653 Teal Dr
- 2698 Tyler Way
- 2641 Mandarin Ct
- 2657 Teal Dr
- 2697 Decker Way
- 2692 Tyler Way
- 2640 Teal Dr
- 2761 Pintail Ct
- 2691 Decker Way
- 2773 Pintail Ct
- 2693 Tyler Way
- 2661 Summerfield Dr
- 2637 Mandarin Ct
- 2686 Tyler Way
- 2673 Summerfield Dr
- 2683 Decker Way
- 2687 Tyler Way
- 2785 Pintail Ct
- 2658 Teal Dr