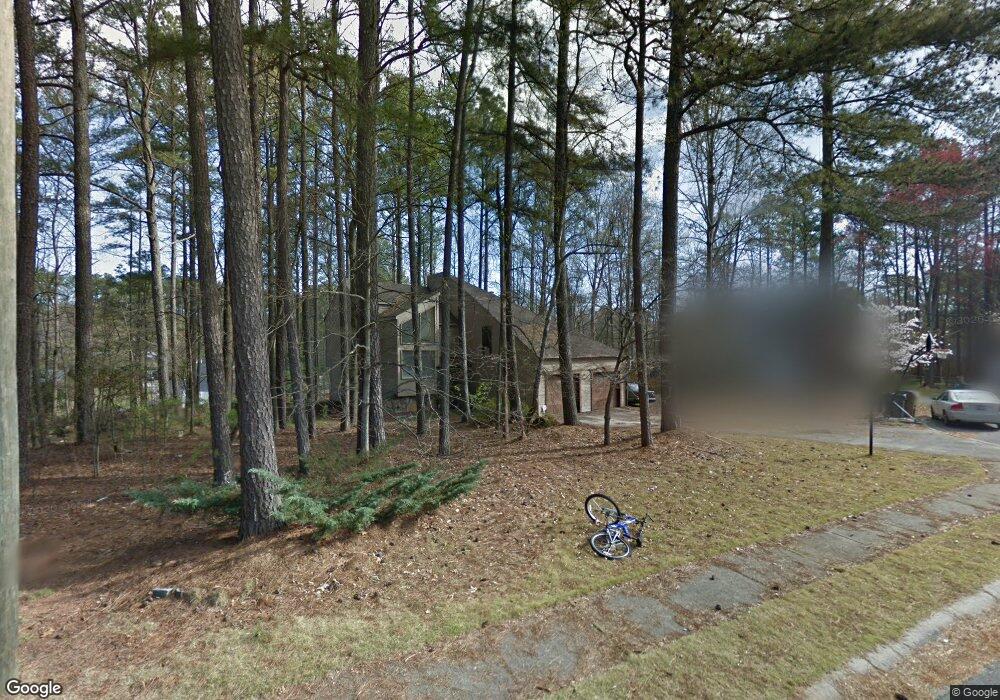
2649 Spear Point Ct Unit 3 Marietta, GA 30062
East Cobb NeighborhoodEstimated Value: $423,000 - $544,000
3
Beds
3
Baths
2,132
Sq Ft
$223/Sq Ft
Est. Value
About This Home
This home is located at 2649 Spear Point Ct Unit 3, Marietta, GA 30062 and is currently estimated at $474,604, approximately $222 per square foot. 2649 Spear Point Ct Unit 3 is a home located in Cobb County with nearby schools including Murdock Elementary School, Dodgen Middle School, and Pope High School.
Ownership History
Date
Name
Owned For
Owner Type
Purchase Details
Closed on
Jun 5, 2020
Sold by
Griffin Ricky C and Griffin Rick
Bought by
Griffin Ricky C and Griffin Shelia M
Current Estimated Value
Home Financials for this Owner
Home Financials are based on the most recent Mortgage that was taken out on this home.
Original Mortgage
$150,000
Outstanding Balance
$132,159
Interest Rate
3%
Mortgage Type
New Conventional
Estimated Equity
$342,445
Purchase Details
Closed on
Jul 30, 1999
Sold by
Hopson Joseph E
Bought by
Griffin Ricky C
Home Financials for this Owner
Home Financials are based on the most recent Mortgage that was taken out on this home.
Original Mortgage
$130,000
Interest Rate
7.66%
Mortgage Type
New Conventional
Purchase Details
Closed on
Nov 21, 1995
Sold by
Ullian Jay A Donna
Bought by
Hopson Joseph E
Create a Home Valuation Report for This Property
The Home Valuation Report is an in-depth analysis detailing your home's value as well as a comparison with similar homes in the area
Home Values in the Area
Average Home Value in this Area
Purchase History
| Date | Buyer | Sale Price | Title Company |
|---|---|---|---|
| Griffin Ricky C | -- | Fidelity National Title | |
| Griffin Ricky C | $145,600 | -- | |
| Hopson Joseph E | $109,000 | -- |
Source: Public Records
Mortgage History
| Date | Status | Borrower | Loan Amount |
|---|---|---|---|
| Open | Griffin Ricky C | $150,000 | |
| Closed | Griffin Ricky C | $130,000 |
Source: Public Records
Tax History Compared to Growth
Tax History
| Year | Tax Paid | Tax Assessment Tax Assessment Total Assessment is a certain percentage of the fair market value that is determined by local assessors to be the total taxable value of land and additions on the property. | Land | Improvement |
|---|---|---|---|---|
| 2025 | $950 | $185,024 | $44,000 | $141,024 |
| 2024 | $954 | $185,024 | $44,000 | $141,024 |
| 2023 | $638 | $148,360 | $28,000 | $120,360 |
| 2022 | $844 | $148,360 | $28,000 | $120,360 |
| 2021 | $749 | $116,476 | $28,000 | $88,476 |
| 2020 | $2,761 | $116,476 | $28,000 | $88,476 |
| 2019 | $2,761 | $116,476 | $28,000 | $88,476 |
| 2018 | $2,124 | $87,388 | $26,000 | $61,388 |
| 2017 | $1,800 | $75,876 | $22,000 | $53,876 |
| 2016 | $1,802 | $75,876 | $22,000 | $53,876 |
| 2015 | $1,691 | $69,048 | $14,000 | $55,048 |
| 2014 | $1,703 | $69,048 | $0 | $0 |
Source: Public Records
Map
Nearby Homes
- 2540 Stoney Brook Ln NE
- 2138 Cedar Forks Dr Unit 2
- 2186 Cedar Forks Dr
- 2197 Cedar Forks Dr Unit 1
- 2451 Cedar Fork Trail Unit 5
- 2161 Deep Woods Way Unit 3
- 2404 Pondside Ct NE
- 2153 Deep Woods Way
- 2260 Falkirk Pointe Dr
- 2581 Oak Village Place NE
- 2265 Piedmont Glen Ct Unit 1
- 2998 Kodiak Ct
- 1900 Holly Springs Rd NE
- 2919 Manitoba Ln
- 2641 Nicholas Ct NE
- 2671 Nicholas Ct NE
- 2255 Abbey Cove Ct
- 3025 Bunker Hill Cir
- 2072 Fairport Way
- 1957 Carver Ln NE
- 2635 Spear Point Ct Unit 3
- 2563 Spear Point Trail
- 2657 Spear Point Ct
- 2623 Warwick Dr
- 2660 Spear Point Ct
- 2627 Spear Point Ct
- 2652 Spear Point Ct
- 2640 Spear Point Ct
- 2613 Warwick Dr
- 2658 Spear Point Ct Unit 3
- 2626 Spear Point Ct
- 2653 Warwick Dr
- 2619 Spear Point Ct Unit 3
- 2603 Warwick Dr
- 2262 Cedar Forks Trace
- 2263 Cedar Forks Trace
- 2612 Spear Point Ct
- 2330 Holly Springs Rd NE
- 2609 Spear Point Ct
- 2609 Spear Point Ct Unit 3