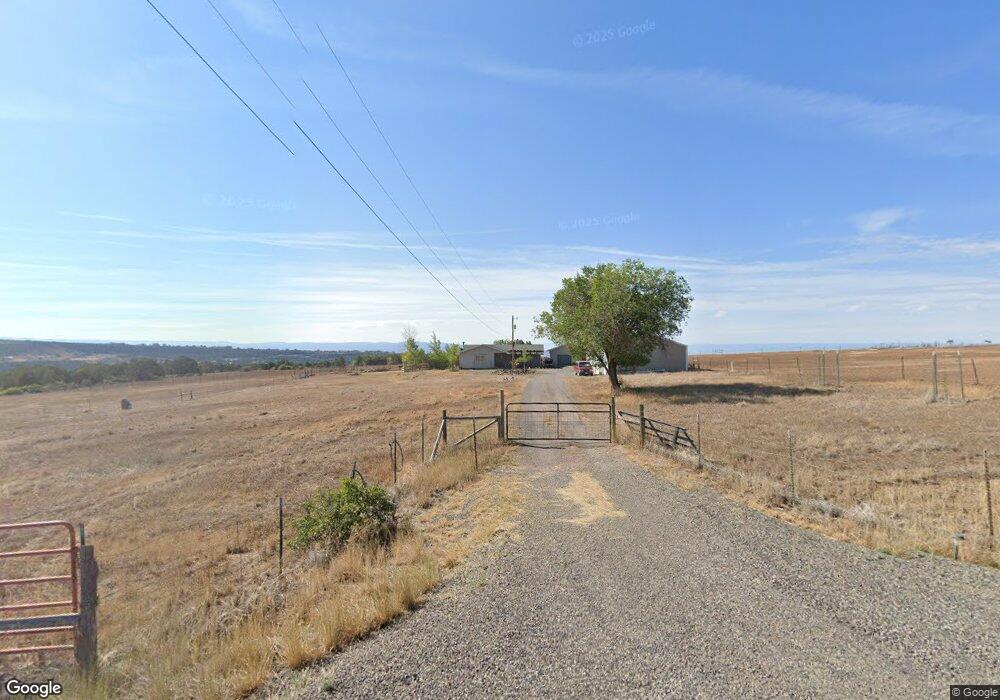
26494 Cedar Mesa Rd Cedaredge, CO 81413
Estimated Value: $499,886 - $656,000
3
Beds
2
Baths
1,901
Sq Ft
$308/Sq Ft
Est. Value
About This Home
This home is located at 26494 Cedar Mesa Rd, Cedaredge, CO 81413 and is currently estimated at $585,472, approximately $307 per square foot. 26494 Cedar Mesa Rd is a home located in Delta County with nearby schools including Cedaredge Elementary School, Cedaredge Middle School, and Cedaredge High School.
Ownership History
Date
Name
Owned For
Owner Type
Purchase Details
Closed on
Dec 4, 2023
Sold by
Holt William L and Holt Julie R
Bought by
Holt William L and Holt Julie R
Current Estimated Value
Purchase Details
Closed on
Apr 6, 2018
Sold by
Warwick Charles O and Warwick Penelope A
Bought by
Carlill Randy Timothy and Carlill Diana K
Home Financials for this Owner
Home Financials are based on the most recent Mortgage that was taken out on this home.
Original Mortgage
$235,000
Interest Rate
4.4%
Mortgage Type
New Conventional
Purchase Details
Closed on
May 20, 2015
Sold by
Holt Julie R and Holt William L
Bought by
Warwick Charles O and Warwick Penelope A
Home Financials for this Owner
Home Financials are based on the most recent Mortgage that was taken out on this home.
Original Mortgage
$280,000
Interest Rate
3.68%
Mortgage Type
VA
Create a Home Valuation Report for This Property
The Home Valuation Report is an in-depth analysis detailing your home's value as well as a comparison with similar homes in the area
Purchase History
| Date | Buyer | Sale Price | Title Company |
|---|---|---|---|
| Holt William L | -- | None Listed On Document | |
| Carlill Randy Timothy | -- | Land Title Guarantee | |
| Carlill Randy Timothy | $360,000 | Land Title Guarantee | |
| Warwick Charles O | $280,000 | None Available |
Source: Public Records
Mortgage History
| Date | Status | Borrower | Loan Amount |
|---|---|---|---|
| Previous Owner | Carlill Randy Timothy | $235,000 | |
| Previous Owner | Warwick Charles O | $280,000 |
Source: Public Records
Tax History
| Year | Tax Paid | Tax Assessment Tax Assessment Total Assessment is a certain percentage of the fair market value that is determined by local assessors to be the total taxable value of land and additions on the property. | Land | Improvement |
|---|---|---|---|---|
| 2023 | $1,773 | $28,682 | $6,234 | $22,448 |
| 2022 | $1,449 | $24,120 | $4,240 | $19,880 |
| 2021 | $1,454 | $24,814 | $4,362 | $20,452 |
| 2020 | $1,348 | $22,645 | $3,933 | $18,712 |
| 2019 | $1,351 | $22,645 | $3,933 | $18,712 |
| 2018 | $690 | $18,322 | $3,600 | $14,722 |
| 2017 | $690 | $18,322 | $3,600 | $14,722 |
| 2016 | $1,044 | $18,506 | $5,333 | $13,173 |
Source: Public Records
Map
Nearby Homes
- 26313 Cedar Mesa Rd
- TBD Lot 14 2625 Ln
- TBD Lot 11 2625 Ln
- TBD Lot 7 Stardust Ln
- TBD Lot 8 Stardust Ln
- TBD Lot 4 Stardust Ln
- TBD Lot 9 Stardust Ln
- 15969 Stardust Ln
- 15736 2600 Rd
- 15770 Heavens View Rd
- 15842 Heavens View Rd
- 16216 2600 Rd
- 15138 2600 Rd
- 27459 Cedar Mesa Rd
- 25352 Cedar Mesa Rd
- 15369 2525 Rd
- Lot 1 2500 Rd
- 16709 Cedar Ln
- TBD Cactus Park Rd
- 17656 2550 Rd
- 26443 Cedar Mesa Rd
- 26447 Cedar Mesa Rd
- 26380 Cedar Mesa Rd
- 26692 Cedar Mesa Rd
- 26681 Cedar Mesa Rd
- 26347 Cedar Mesa Rd
- 16211 2675 Ln
- 26685 Cedar Mesa Rd
- 26696 Cedar Mesa Rd
- 26786 Cedar Mesa Rd
- 26795 Cedar Mesa Rd
- 26253 Cedar Mesa Rd
- 26898 Cedar Mesa Rd
- 0 Cedar Mesa Rd Unit 769335
- 0 Cedar Mesa Rd Unit 764723
- 0 Cedar Mesa Rd Unit 761879
- 0 Cedar Mesa Rd Unit 760906
- 0 Cedar Mesa Rd Unit 759966
- 0 Cedar Mesa Rd Unit 759500
- 0 Cedar Mesa Rd Unit 757710
Your Personal Tour Guide
Ask me questions while you tour the home.