
Seller's Agent in 2023
Tom Fleming
Boston Boutique Realty
(617) 433-7149
11 in this area
36 Total Sales
Estimated Value: $595,000 - $712,000
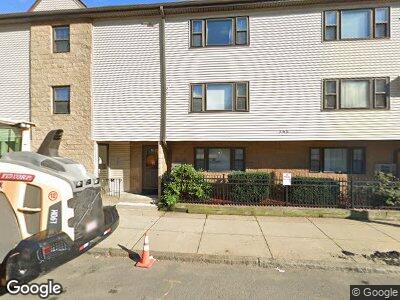
Brand new renovation at this spacious 1 bed/1 bath with parking and private balcony. Over 900 sq ft of living space, hardwood throughout, and an updated kitchen. 1 assigned parking spot included with rent. Don't miss out on this deal!
| Date | Buyer | Sale Price | Title Company |
|---|---|---|---|
| 265 C Street Unit 5 Rt | $430,000 | -- | |
| Burns Vinita M | $72,386 | -- | |
| Federal National Mortgage Association | $69,540 | -- |
| Date | Status | Borrower | Loan Amount |
|---|---|---|---|
| Open | 265 C Street Unit 5 Rt | $301,000 |
| Date | Event | Price | Change | Sq Ft Price |
|---|---|---|---|---|
| 05/02/2023 05/02/23 | Rented | $2,999 | 0.0% | -- |
| 05/02/2023 05/02/23 | Under Contract | -- | -- | -- |
| 04/27/2023 04/27/23 | For Rent | $2,999 | +25.0% | -- |
| 08/03/2020 08/03/20 | Rented | $2,399 | 0.0% | -- |
| 08/03/2020 08/03/20 | Under Contract | -- | -- | -- |
| 07/28/2020 07/28/20 | Price Changed | $2,399 | -3.8% | $3 / Sq Ft |
| 07/21/2020 07/21/20 | Price Changed | $2,495 | -7.6% | $3 / Sq Ft |
| 07/17/2020 07/17/20 | Price Changed | $2,699 | -6.9% | $3 / Sq Ft |
| 06/24/2020 06/24/20 | Price Changed | $2,900 | -3.3% | $3 / Sq Ft |
| 06/01/2020 06/01/20 | For Rent | $3,000 | +7.1% | -- |
| 05/18/2018 05/18/18 | Rented | $2,800 | 0.0% | -- |
| 05/18/2018 05/18/18 | Under Contract | -- | -- | -- |
| 05/15/2018 05/15/18 | For Rent | $2,800 | 0.0% | -- |
| 08/15/2017 08/15/17 | Sold | $430,000 | +7.8% | $468 / Sq Ft |
| 07/18/2017 07/18/17 | Pending | -- | -- | -- |
| 07/13/2017 07/13/17 | For Sale | $399,000 | -- | $435 / Sq Ft |
| Year | Tax Paid | Tax Assessment Tax Assessment Total Assessment is a certain percentage of the fair market value that is determined by local assessors to be the total taxable value of land and additions on the property. | Land | Improvement |
|---|---|---|---|---|
| 2025 | $6,353 | $548,600 | $0 | $548,600 |
| 2024 | $5,919 | $543,000 | $0 | $543,000 |
| 2023 | $5,662 | $527,200 | $0 | $527,200 |
| 2022 | $5,568 | $511,800 | $0 | $511,800 |
| 2021 | $5,412 | $507,200 | $0 | $507,200 |
| 2020 | $4,701 | $445,200 | $0 | $445,200 |
| 2019 | $4,346 | $412,300 | $0 | $412,300 |
| 2018 | $3,948 | $376,700 | $0 | $376,700 |
| 2017 | $3,694 | $348,800 | $0 | $348,800 |
| 2016 | $3,654 | $332,200 | $0 | $332,200 |
| 2015 | $3,988 | $329,300 | $0 | $329,300 |
| 2014 | $3,641 | $289,400 | $0 | $289,400 |
Seller's Agent in 2023
Tom Fleming
Boston Boutique Realty
(617) 433-7149
11 in this area
36 Total Sales
B
Buyer's Agent in 2020
BR Brokerage
Boston Residential
(617) 433-7149
5 in this area
6 Total Sales
Buyer's Agent in 2018
Pauline Goldon
Real Estate Resources
(781) 336-6975
7 Total Sales
Seller's Agent in 2017
Stephen McCarthy
William Raveis R.E. & Home Services
(617) 320-7219
29 in this area
53 Total Sales