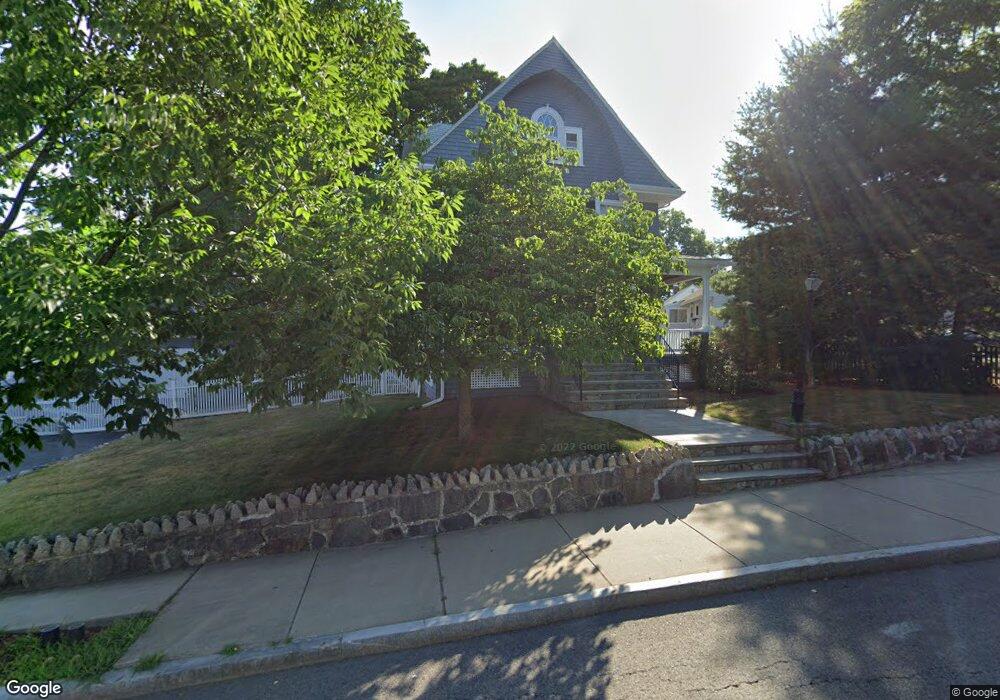
265 Corey St West Roxbury, MA 02132
West Roxbury NeighborhoodEstimated Value: $1,016,000 - $1,254,000
5
Beds
2
Baths
2,348
Sq Ft
$479/Sq Ft
Est. Value
About This Home
This home is located at 265 Corey St, West Roxbury, MA 02132 and is currently estimated at $1,123,783, approximately $478 per square foot. 265 Corey St is a home located in Suffolk County with nearby schools including Holy Name Parish School, St Theresa School, and The Roxbury Latin School.
Ownership History
Date
Name
Owned For
Owner Type
Purchase Details
Closed on
Jul 12, 2004
Sold by
Flynn Eileen and Flynn David T
Bought by
Conley Daniel F and Conley Patricia
Current Estimated Value
Home Financials for this Owner
Home Financials are based on the most recent Mortgage that was taken out on this home.
Original Mortgage
$186,300
Outstanding Balance
$93,363
Interest Rate
6.16%
Estimated Equity
$1,030,420
Purchase Details
Closed on
Jan 20, 2000
Sold by
Corbeille Dorothy
Bought by
Flynn David T and Flynn Eileen
Create a Home Valuation Report for This Property
The Home Valuation Report is an in-depth analysis detailing your home's value as well as a comparison with similar homes in the area
Home Values in the Area
Average Home Value in this Area
Purchase History
| Date | Buyer | Sale Price | Title Company |
|---|---|---|---|
| Conley Daniel F | $650,000 | -- | |
| Flynn David T | $137,500 | -- | |
| Flynn David T | $137,500 | -- |
Source: Public Records
Mortgage History
| Date | Status | Borrower | Loan Amount |
|---|---|---|---|
| Open | Flynn David T | $186,300 | |
| Open | Flynn David T | $333,700 |
Source: Public Records
Tax History Compared to Growth
Tax History
| Year | Tax Paid | Tax Assessment Tax Assessment Total Assessment is a certain percentage of the fair market value that is determined by local assessors to be the total taxable value of land and additions on the property. | Land | Improvement |
|---|---|---|---|---|
| 2025 | $10,425 | $900,300 | $275,600 | $624,700 |
| 2024 | $9,175 | $841,700 | $272,800 | $568,900 |
| 2023 | $8,525 | $793,800 | $257,200 | $536,600 |
| 2022 | $7,852 | $721,700 | $233,900 | $487,800 |
| 2021 | $7,213 | $676,000 | $224,900 | $451,100 |
| 2020 | $6,759 | $640,100 | $186,500 | $453,600 |
| 2019 | $6,249 | $592,900 | $158,900 | $434,000 |
| 2018 | $5,977 | $570,300 | $158,900 | $411,400 |
| 2017 | $5,977 | $564,400 | $158,900 | $405,500 |
| 2016 | $5,803 | $527,500 | $158,900 | $368,600 |
| 2015 | $5,704 | $471,000 | $163,200 | $307,800 |
| 2014 | $5,589 | $444,300 | $163,200 | $281,100 |
Source: Public Records
Map
Nearby Homes
- 701 Vfw Pkwy
- 168 Maple St
- 37 Pomfret St
- 19 Pomfret St
- 76 Vermont St
- 845 Lagrange St Unit 4
- 37 Hastings St Unit 103
- 865 Lagrange St Unit 5
- 9 Carroll St
- 139 Newfield St
- 76 Potomac St
- 55 Redlands Rd
- 539 Lagrange St
- 1789 Centre St Unit 202
- 931 Lagrange St
- 331 Vermont St
- 110 Park St Unit 3
- 577 Baker St Unit 577
- 10 Burwell Rd
- 23 Westgate Rd Unit 6