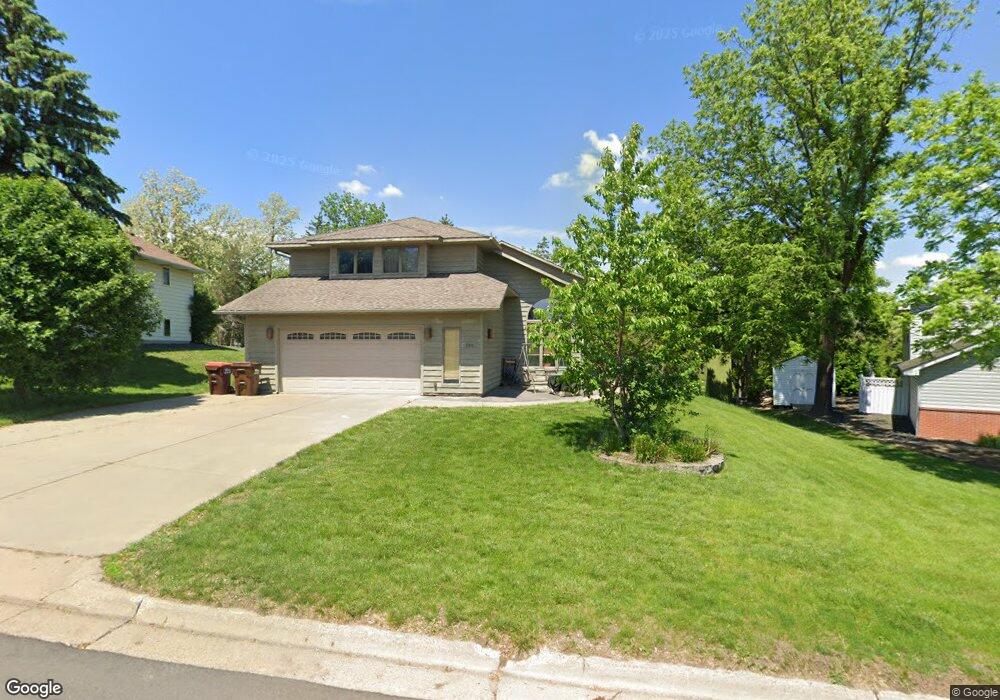
265 Crestview Dr Hastings, MN 55033
Hastings-Marshan Township NeighborhoodEstimated Value: $513,690 - $580,000
4
Beds
3
Baths
4,080
Sq Ft
$132/Sq Ft
Est. Value
About This Home
This home is located at 265 Crestview Dr, Hastings, MN 55033 and is currently estimated at $538,673, approximately $132 per square foot. 265 Crestview Dr is a home located in Dakota County with nearby schools including Christa Mcauliffe Elementary School, Hastings Middle School, and Hastings High School.
Ownership History
Date
Name
Owned For
Owner Type
Purchase Details
Closed on
Apr 26, 2019
Sold by
Kennedy Jared D and Kennedy Matthew
Bought by
Truhier Derek S and Truhier Samantha A
Current Estimated Value
Home Financials for this Owner
Home Financials are based on the most recent Mortgage that was taken out on this home.
Original Mortgage
$330,000
Outstanding Balance
$290,129
Interest Rate
4.3%
Mortgage Type
New Conventional
Estimated Equity
$248,544
Purchase Details
Closed on
Apr 29, 2016
Sold by
Bennis Teresa J
Bought by
Kennedy Jared D and Kennedy Matthew
Home Financials for this Owner
Home Financials are based on the most recent Mortgage that was taken out on this home.
Original Mortgage
$331,705
Interest Rate
3.5%
Mortgage Type
FHA
Purchase Details
Closed on
Jun 13, 2005
Sold by
Dotson David S and Dotson Linda K
Bought by
Bennis Teresa J
Create a Home Valuation Report for This Property
The Home Valuation Report is an in-depth analysis detailing your home's value as well as a comparison with similar homes in the area
Home Values in the Area
Average Home Value in this Area
Purchase History
| Date | Buyer | Sale Price | Title Company |
|---|---|---|---|
| Truhier Derek S | $360,000 | Bankers Title | |
| Kennedy Jared D | $340,000 | Burnet Title | |
| Bennis Teresa J | $420,000 | -- |
Source: Public Records
Mortgage History
| Date | Status | Borrower | Loan Amount |
|---|---|---|---|
| Open | Truhier Derek S | $330,000 | |
| Previous Owner | Kennedy Jared D | $331,705 |
Source: Public Records
Tax History Compared to Growth
Tax History
| Year | Tax Paid | Tax Assessment Tax Assessment Total Assessment is a certain percentage of the fair market value that is determined by local assessors to be the total taxable value of land and additions on the property. | Land | Improvement |
|---|---|---|---|---|
| 2024 | $6,558 | $496,400 | $92,000 | $404,400 |
| 2023 | $6,558 | $556,300 | $114,600 | $441,700 |
| 2022 | $5,462 | $521,800 | $114,400 | $407,400 |
| 2021 | $5,258 | $443,600 | $99,500 | $344,100 |
| 2020 | $5,394 | $424,000 | $94,800 | $329,200 |
| 2019 | $5,154 | $420,400 | $90,200 | $330,200 |
| 2018 | $4,935 | $383,300 | $86,000 | $297,300 |
| 2017 | $5,021 | $356,600 | $81,900 | $274,700 |
| 2016 | $5,160 | $360,700 | $76,500 | $284,200 |
| 2015 | $5,020 | $356,359 | $73,226 | $283,133 |
| 2014 | -- | $348,620 | $70,413 | $278,207 |
| 2013 | -- | $318,100 | $63,132 | $254,968 |
Source: Public Records
Map
Nearby Homes
- 300 Whispering Ln Unit 201
- 1372 Featherstone Rd
- 1404 Featherstone Rd
- 325 Crestview Dr
- 401 Whispering Ln
- 404 Pleasant Dr
- 101 Farm St Unit A
- 145x 4th St W
- 1306 Lincoln Ln
- 101 Fraiser St
- 1100 Honeysuckle Ln
- 900 5th St W
- 930 Lyn Way Unit 204
- 822 5th St W
- 1227 14th St W
- 1882 13th St W Unit 802
- 1498 Hillside St
- 626 6th St W
- 1967 Sierra Dr Unit 303
- 1451 17th St W
- 275 Crestview Dr
- 255 Crestview Dr
- 279 Crestview Dr
- 225 Whispering Ln
- 260 Crestview Dr
- 270 Crestview Dr
- 250 Crestview Dr
- 280 Crestview Dr
- 205 Whispering Ln
- 285 Crestview Dr
- 305 Theo Ct
- 275 Whispering Ln
- 290 Crestview Dr
- 315 Theo Ct
- 289 Crestview Dr
- 305 Whispering Ln
- 300 Theo Ct
- 300 Crestview Dr
- 1403 Featherstone Rd
- 295 Crestview Dr