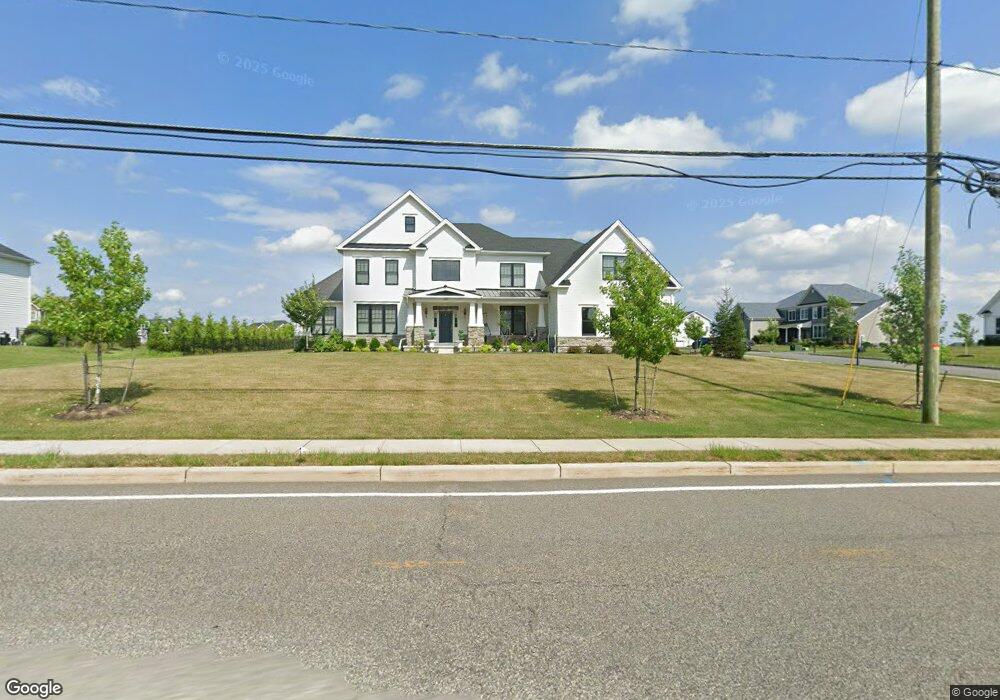
265 E Crescent Ave Mahwah, NJ 07430
Estimated Value: $1,927,964 - $2,321,000
4
Beds
4
Baths
5,374
Sq Ft
$395/Sq Ft
Est. Value
About This Home
This home is located at 265 E Crescent Ave, Mahwah, NJ 07430 and is currently estimated at $2,124,741, approximately $395 per square foot. 265 E Crescent Ave is a home located in Bergen County with nearby schools including Mahwah High School and ONESCHOOL GLOBAL-NEW YORK.
Ownership History
Date
Name
Owned For
Owner Type
Purchase Details
Closed on
Jun 9, 2021
Sold by
Toll Nj Iv Llc
Bought by
Patel Devang and Patel Nipa
Current Estimated Value
Home Financials for this Owner
Home Financials are based on the most recent Mortgage that was taken out on this home.
Original Mortgage
$1,248,301
Outstanding Balance
$1,130,181
Interest Rate
2.9%
Mortgage Type
New Conventional
Estimated Equity
$994,560
Create a Home Valuation Report for This Property
The Home Valuation Report is an in-depth analysis detailing your home's value as well as a comparison with similar homes in the area
Home Values in the Area
Average Home Value in this Area
Purchase History
| Date | Buyer | Sale Price | Title Company |
|---|---|---|---|
| Patel Devang | $1,560,377 | Westminster Abstract Company | |
| Patel Devang | $1,560,377 | Soto Rosemary |
Source: Public Records
Mortgage History
| Date | Status | Borrower | Loan Amount |
|---|---|---|---|
| Open | Patel Devang | $1,248,301 | |
| Closed | Patel Devang | $1,248,301 |
Source: Public Records
Tax History
| Year | Tax Paid | Tax Assessment Tax Assessment Total Assessment is a certain percentage of the fair market value that is determined by local assessors to be the total taxable value of land and additions on the property. | Land | Improvement |
|---|---|---|---|---|
| 2025 | $23,802 | $1,153,200 | $420,300 | $732,900 |
| 2024 | $23,491 | $1,153,200 | $420,300 | $732,900 |
| 2023 | $22,741 | $1,153,200 | $420,300 | $732,900 |
| 2022 | $22,741 | $1,153,200 | $420,300 | $732,900 |
| 2021 | $8,200 | $420,300 | $420,300 | $0 |
| 2020 | $8,003 | $420,300 | $420,300 | $0 |
| 2019 | $7,738 | $420,300 | $420,300 | $0 |
| 2018 | $7,628 | $420,300 | $420,300 | $0 |
Source: Public Records
Map
Nearby Homes
- 37 Niagara Dr Unit 37
- 15 Roxbury Rd
- 89 Fisher Rd
- 11 Osborne Ct
- 653 Richmond Ct
- 272 Belmont Place
- 19 Meadowbrook Rd
- 243 Cambridge Dr Unit 243
- 826 Georgetown Dr
- 300 Coventry Ct
- 900 Somerset Ct
- 22 Peach Hill Ct
- 81 E Crescent Ave
- 10 Romopock Ct
- 6 Romopock Ct
- 64 Peach Hill Ct
- 62 E Crescent Ave
- 182 Airmont Ave
- 2213 Hilltop Rd
- 5 S Bayard Ln
- 261 E Crescent Ave
- 99 Roxbury Rd
- 35 Roxbury Rd
- 1 Braeburn Ct
- 31 Roxbury Rd
- 39 Roxbury Rd
- 260 E Crescent Ave
- 6 Braeburn Ct
- 256 E Crescent Ave
- 257 E Crescent Ave
- 7 Braeburn Ct
- 253 E Crescent Ave
- 400 Apple Ridge Blvd
- 2 Braeburn Ct
- 273 E Crescent Ave
- 46 Southerland Dr
- 47 Southerland Dr
- 27 Roxbury Rd
- 249 E Crescent Ave
- 23 Roxbury Rd
Your Personal Tour Guide
Ask me questions while you tour the home.