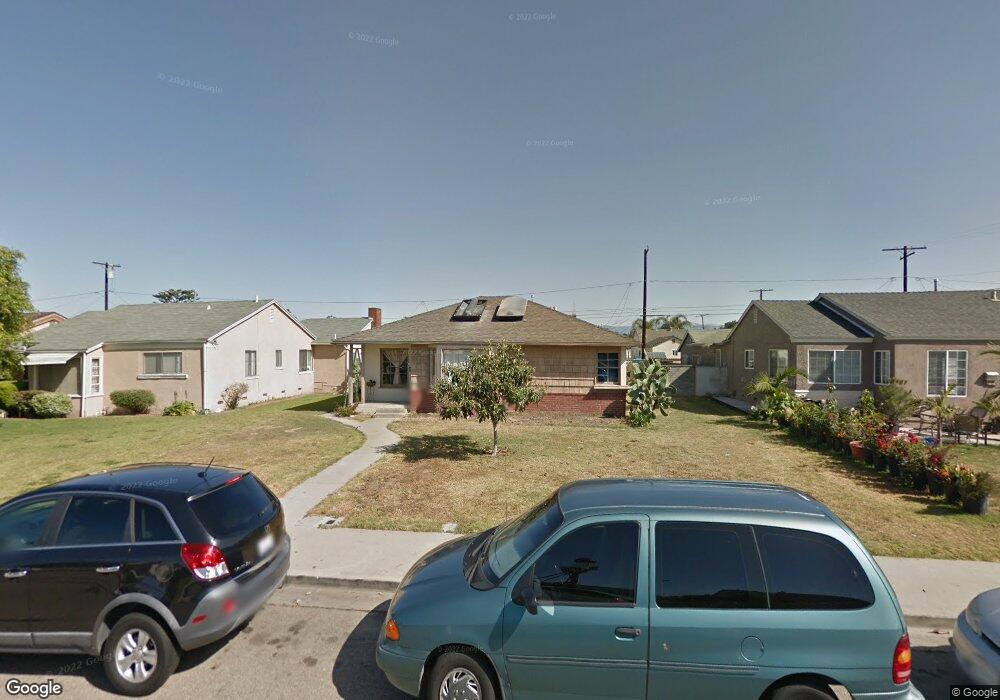
265 E Guava St Oxnard, CA 93033
Cal-Gisler NeighborhoodEstimated Value: $555,000 - $653,206
3
Beds
1
Bath
1,087
Sq Ft
$555/Sq Ft
Est. Value
About This Home
This home is located at 265 E Guava St, Oxnard, CA 93033 and is currently estimated at $603,552, approximately $555 per square foot. 265 E Guava St is a home located in Ventura County with nearby schools including Elm Street Elementary School, R.J. Frank Academy of Marine Science & Engineering, and Santa Clara High School.
Ownership History
Date
Name
Owned For
Owner Type
Purchase Details
Closed on
Dec 20, 2010
Sold by
Arroyo Sofia
Bought by
Casas Carlos
Current Estimated Value
Home Financials for this Owner
Home Financials are based on the most recent Mortgage that was taken out on this home.
Original Mortgage
$219,296
Interest Rate
4.82%
Mortgage Type
FHA
Purchase Details
Closed on
Oct 29, 2010
Sold by
Federal National Mortgage Association
Bought by
Casas Carlos
Home Financials for this Owner
Home Financials are based on the most recent Mortgage that was taken out on this home.
Original Mortgage
$219,296
Interest Rate
4.82%
Mortgage Type
FHA
Purchase Details
Closed on
Mar 11, 2010
Sold by
Ruiz Maria
Bought by
Federal National Mortgage Association
Purchase Details
Closed on
Jun 2, 2006
Sold by
Lopez Sergio
Bought by
Ruiz Maria
Home Financials for this Owner
Home Financials are based on the most recent Mortgage that was taken out on this home.
Original Mortgage
$109,600
Interest Rate
6.57%
Mortgage Type
Credit Line Revolving
Purchase Details
Closed on
Nov 16, 2005
Sold by
Ruiz Maria
Bought by
Lopez Sergio and Ruiz Maria
Home Financials for this Owner
Home Financials are based on the most recent Mortgage that was taken out on this home.
Original Mortgage
$425,000
Interest Rate
6.25%
Mortgage Type
New Conventional
Purchase Details
Closed on
Aug 10, 2004
Sold by
Ruiz Maria and Cerda Francisco H
Bought by
Ruiz Maria
Home Financials for this Owner
Home Financials are based on the most recent Mortgage that was taken out on this home.
Original Mortgage
$247,000
Interest Rate
7.35%
Mortgage Type
Purchase Money Mortgage
Purchase Details
Closed on
Jul 30, 2004
Sold by
Lopez Sergio
Bought by
Ruiz Maria
Home Financials for this Owner
Home Financials are based on the most recent Mortgage that was taken out on this home.
Original Mortgage
$247,000
Interest Rate
7.35%
Mortgage Type
Purchase Money Mortgage
Create a Home Valuation Report for This Property
The Home Valuation Report is an in-depth analysis detailing your home's value as well as a comparison with similar homes in the area
Home Values in the Area
Average Home Value in this Area
Purchase History
| Date | Buyer | Sale Price | Title Company |
|---|---|---|---|
| Casas Carlos | -- | Lsi Title Company Ca | |
| Casas Carlos | $225,000 | Lsi Title Company Ca | |
| Federal National Mortgage Association | $483,117 | Landsafe Title | |
| Ruiz Maria | -- | Lawyers Title Company | |
| Lopez Sergio | -- | Landsafe Title | |
| Ruiz Maria | $123,500 | Ticor Title Company Of Ca | |
| Ruiz Maria | -- | Ticor Title Company Of Ca |
Source: Public Records
Mortgage History
| Date | Status | Borrower | Loan Amount |
|---|---|---|---|
| Previous Owner | Casas Carlos | $219,296 | |
| Previous Owner | Ruiz Maria | $109,600 | |
| Previous Owner | Ruiz Maria | $383,600 | |
| Previous Owner | Lopez Sergio | $425,000 | |
| Previous Owner | Ruiz Maria | $247,000 |
Source: Public Records
Tax History
| Year | Tax Paid | Tax Assessment Tax Assessment Total Assessment is a certain percentage of the fair market value that is determined by local assessors to be the total taxable value of land and additions on the property. | Land | Improvement |
|---|---|---|---|---|
| 2025 | $3,438 | $288,248 | $137,075 | $151,173 |
| 2024 | $3,438 | $282,597 | $134,388 | $148,209 |
| 2023 | $3,312 | $277,056 | $131,753 | $145,303 |
| 2022 | $3,211 | $271,624 | $129,170 | $142,454 |
| 2021 | $3,184 | $266,299 | $126,638 | $139,661 |
| 2020 | $3,242 | $263,571 | $125,341 | $138,230 |
| 2019 | $3,149 | $258,404 | $122,884 | $135,520 |
| 2018 | $3,104 | $253,338 | $120,475 | $132,863 |
| 2017 | $2,945 | $248,371 | $118,113 | $130,258 |
| 2016 | $2,924 | $243,502 | $115,798 | $127,704 |
| 2015 | $2,955 | $239,846 | $114,059 | $125,787 |
| 2014 | $2,923 | $235,150 | $111,826 | $123,324 |
Source: Public Records
Map
Nearby Homes
- 225 W Iris St
- 1239 S C St
- 2024 S J St
- 1127 S C St
- 3151 Fournier St
- 3130 Paula St
- 865 S B St Unit Q1
- 819 S B St Unit 34
- 3631 La Costa Place
- 633 Meta St
- 1030 Ilena St
- 2151 E Wooley Rd
- 3638 S B St
- 860 Morro Way
- 360 Ibsen Place Unit 129
- 140 Gaviota Place Unit 157
- 1431 Casa San Carlos Ln Unit B
- 1140 Teakwood St
- 1928 San Benito St
- 775 Thayer Ln
Your Personal Tour Guide
Ask me questions while you tour the home.