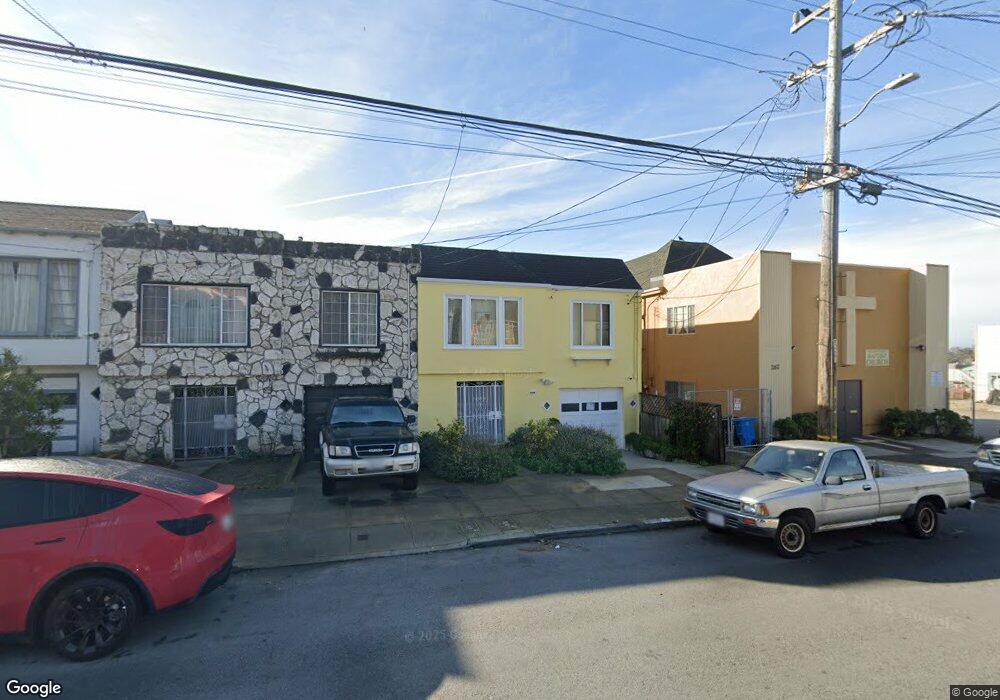
265 Farallones St San Francisco, CA 94112
Oceanview NeighborhoodEstimated Value: $874,000 - $1,018,000
--
Bed
1
Bath
1,006
Sq Ft
$961/Sq Ft
Est. Value
About This Home
This home is located at 265 Farallones St, San Francisco, CA 94112 and is currently estimated at $966,866, approximately $961 per square foot. 265 Farallones St is a home located in San Francisco County with nearby schools including Sheridan Elementary School, Denman (James) Middle School, and Stratford School.
Ownership History
Date
Name
Owned For
Owner Type
Purchase Details
Closed on
Oct 24, 2002
Sold by
Fleming Wilbur L and Fleming Laura B
Bought by
Maeshiro Ken and Miyazaki Saori
Current Estimated Value
Home Financials for this Owner
Home Financials are based on the most recent Mortgage that was taken out on this home.
Original Mortgage
$230,000
Outstanding Balance
$95,226
Interest Rate
5.99%
Estimated Equity
$871,640
Create a Home Valuation Report for This Property
The Home Valuation Report is an in-depth analysis detailing your home's value as well as a comparison with similar homes in the area
Home Values in the Area
Average Home Value in this Area
Purchase History
| Date | Buyer | Sale Price | Title Company |
|---|---|---|---|
| Maeshiro Ken | $412,500 | Fidelity National Title Co |
Source: Public Records
Mortgage History
| Date | Status | Borrower | Loan Amount |
|---|---|---|---|
| Open | Maeshiro Ken | $230,000 |
Source: Public Records
Tax History Compared to Growth
Tax History
| Year | Tax Paid | Tax Assessment Tax Assessment Total Assessment is a certain percentage of the fair market value that is determined by local assessors to be the total taxable value of land and additions on the property. | Land | Improvement |
|---|---|---|---|---|
| 2025 | $7,568 | $597,394 | $358,442 | $238,952 |
| 2024 | $7,568 | $585,682 | $351,414 | $234,268 |
| 2023 | $7,446 | $574,200 | $344,524 | $229,676 |
| 2022 | $7,291 | $562,944 | $337,770 | $225,174 |
| 2021 | $7,157 | $551,908 | $331,148 | $220,760 |
| 2020 | $7,203 | $546,252 | $327,754 | $218,498 |
| 2019 | $6,958 | $535,542 | $321,328 | $214,214 |
| 2018 | $6,723 | $525,042 | $315,028 | $210,014 |
| 2017 | $6,344 | $514,750 | $308,852 | $205,898 |
| 2016 | $6,220 | $504,660 | $302,798 | $201,862 |
| 2015 | $6,141 | $497,080 | $298,250 | $198,830 |
| 2014 | $5,979 | $487,344 | $292,408 | $194,936 |
Source: Public Records
Map
Nearby Homes
- 20 Sargent St
- 274 Montana St
- 475 Head St
- 106 Broad St
- 233 Sargent St
- 502 Plymouth Ave
- 914 Capitol Ave
- 63 Minerva St
- 442 Bright St
- 224 Shields St
- 5000 Summit St
- 8100 Oceanview Terrace Unit 112
- 119 Vernon St
- 230 Rhine St
- 171 Margaret Ave
- 451 Ramsell St
- 3223 San Jose Ave
- 34 Brighton Ave
- 230 Ralston St
- 621 Shields St