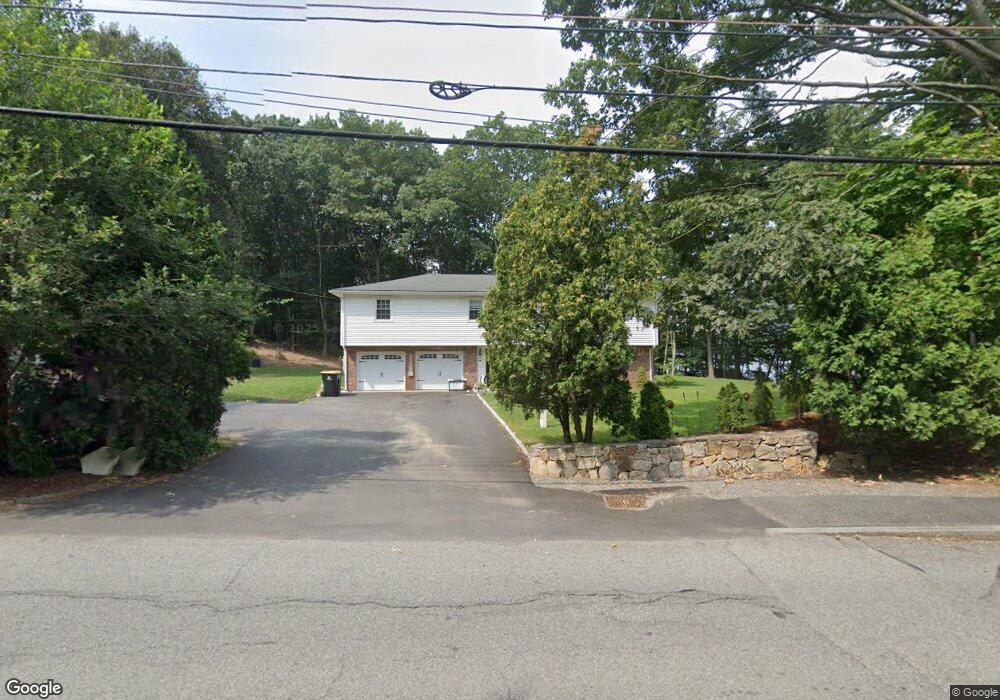
265 Fountain St Framingham, MA 01702
Estimated Value: $615,000 - $744,213
3
Beds
3
Baths
1,512
Sq Ft
$460/Sq Ft
Est. Value
About This Home
This home is located at 265 Fountain St, Framingham, MA 01702 and is currently estimated at $695,803, approximately $460 per square foot. 265 Fountain St is a home located in Middlesex County with nearby schools including Framingham High School, Pincushion Hill Montessori School, and Saint Bridget School.
Ownership History
Date
Name
Owned For
Owner Type
Purchase Details
Closed on
Aug 22, 2017
Sold by
Goldberg Alan L and Osipova-Goldberg Helen I
Bought by
Magri John C and Magri Lisa M
Current Estimated Value
Purchase Details
Closed on
Apr 28, 1995
Sold by
Donovan Christopher J and Donovan Susan A
Bought by
Goldberg Alan L and Ospiva-Goldberg Helen
Home Financials for this Owner
Home Financials are based on the most recent Mortgage that was taken out on this home.
Original Mortgage
$164,900
Interest Rate
8.33%
Mortgage Type
Purchase Money Mortgage
Purchase Details
Closed on
Jun 1, 1994
Sold by
Clarence August 21 Ft and August Clarence
Bought by
Donovan Christopher and Donovan Susan A
Home Financials for this Owner
Home Financials are based on the most recent Mortgage that was taken out on this home.
Original Mortgage
$200,000
Interest Rate
8.49%
Mortgage Type
Purchase Money Mortgage
Create a Home Valuation Report for This Property
The Home Valuation Report is an in-depth analysis detailing your home's value as well as a comparison with similar homes in the area
Home Values in the Area
Average Home Value in this Area
Purchase History
| Date | Buyer | Sale Price | Title Company |
|---|---|---|---|
| Magri John C | $360,000 | -- | |
| Goldberg Alan L | $194,000 | -- | |
| Donovan Christopher | $210,600 | -- |
Source: Public Records
Mortgage History
| Date | Status | Borrower | Loan Amount |
|---|---|---|---|
| Previous Owner | Goldberg Alan L | $164,000 | |
| Previous Owner | Goldberg Alan L | $164,900 | |
| Previous Owner | Donovan Christopher | $200,000 |
Source: Public Records
Tax History Compared to Growth
Tax History
| Year | Tax Paid | Tax Assessment Tax Assessment Total Assessment is a certain percentage of the fair market value that is determined by local assessors to be the total taxable value of land and additions on the property. | Land | Improvement |
|---|---|---|---|---|
| 2025 | $7,743 | $648,500 | $373,600 | $274,900 |
| 2024 | $7,360 | $590,700 | $333,100 | $257,600 |
| 2023 | $6,915 | $528,300 | $297,200 | $231,100 |
| 2022 | $6,583 | $479,100 | $270,100 | $209,000 |
| 2021 | $6,553 | $466,400 | $259,700 | $206,700 |
| 2020 | $6,218 | $415,100 | $218,100 | $197,000 |
| 2019 | $5,843 | $379,900 | $199,900 | $180,000 |
| 2018 | $5,989 | $367,000 | $204,900 | $162,100 |
| 2017 | $6,375 | $381,500 | $172,900 | $208,600 |
| 2016 | $6,283 | $361,500 | $174,500 | $187,000 |
| 2015 | $6,241 | $350,200 | $175,200 | $175,000 |
Source: Public Records
Map
Nearby Homes
- 54 Vose St
- 29 Jodie Rd
- 15 Bellmore Rd
- 8 Bellmore Rd
- 34 Jodie Rd
- 7 Albert Ray Dr
- 37 Wilson Ave
- 53 Wilson Ave
- 212 Fountain St Unit A,212
- 212 Fountain St
- 6 B Harmony Ln Unit 2
- 848 Waverly St
- 327 Singletary Ln
- 818 Waverly St
- 273 Singletary Ln
- 27 Travis Dr
- 26 Wilde Ave
- 12 & 14 Waverly St
- 39 Bethany Rd
- 40 Eden Rd