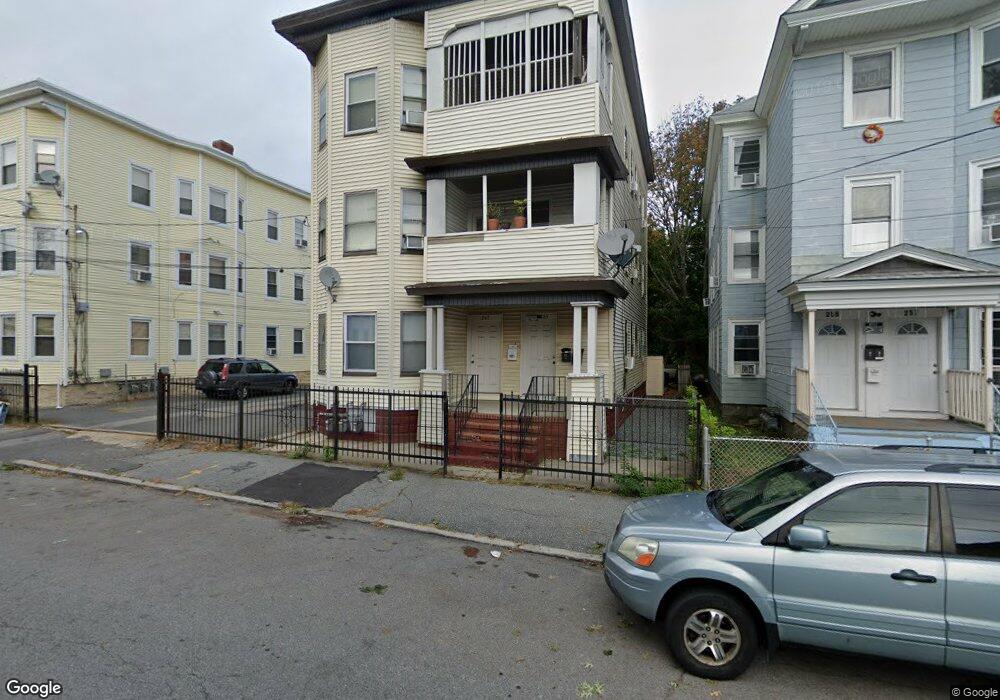
265 Howard St Unit 267 Lawrence, MA 01841
Prospect Hill-Back Bay NeighborhoodEstimated Value: $840,000 - $1,092,000
6
Beds
3
Baths
3,852
Sq Ft
$248/Sq Ft
Est. Value
About This Home
This home is located at 265 Howard St Unit 267, Lawrence, MA 01841 and is currently estimated at $954,000, approximately $247 per square foot. 265 Howard St Unit 267 is a home located in Essex County with nearby schools including School For Exceptional Studies, Community Day Charter Public School - Gateway, and Esperanza Academy School of Hope.
Ownership History
Date
Name
Owned For
Owner Type
Purchase Details
Closed on
Apr 6, 2010
Sold by
Wahome Elizabeth W
Bought by
Melo Diego C
Current Estimated Value
Home Financials for this Owner
Home Financials are based on the most recent Mortgage that was taken out on this home.
Original Mortgage
$162,011
Outstanding Balance
$107,584
Interest Rate
4.94%
Mortgage Type
Purchase Money Mortgage
Estimated Equity
$846,416
Create a Home Valuation Report for This Property
The Home Valuation Report is an in-depth analysis detailing your home's value as well as a comparison with similar homes in the area
Home Values in the Area
Average Home Value in this Area
Purchase History
| Date | Buyer | Sale Price | Title Company |
|---|---|---|---|
| Melo Diego C | $165,000 | -- |
Source: Public Records
Mortgage History
| Date | Status | Borrower | Loan Amount |
|---|---|---|---|
| Open | Melo Diego C | $162,011 |
Source: Public Records
Tax History
| Year | Tax Paid | Tax Assessment Tax Assessment Total Assessment is a certain percentage of the fair market value that is determined by local assessors to be the total taxable value of land and additions on the property. | Land | Improvement |
|---|---|---|---|---|
| 2025 | $6,375 | $724,400 | $121,700 | $602,700 |
| 2024 | $6,495 | $702,200 | $117,600 | $584,600 |
| 2023 | $5,902 | $580,900 | $101,400 | $479,500 |
| 2022 | $5,631 | $492,200 | $94,100 | $398,100 |
| 2021 | $5,336 | $434,900 | $94,100 | $340,800 |
| 2020 | $4,917 | $395,600 | $75,500 | $320,100 |
| 2019 | $5,138 | $375,600 | $78,000 | $297,600 |
| 2018 | $4,728 | $330,200 | $71,000 | $259,200 |
| 2017 | $4,748 | $309,500 | $70,200 | $239,300 |
| 2016 | $4,247 | $273,800 | $46,800 | $227,000 |
| 2015 | $3,975 | $262,900 | $46,800 | $216,100 |
Source: Public Records
Map
Nearby Homes
- 52 Howard St
- 2 Cherry St
- 7 Stevens Ct
- 27 Woodland Ct
- 109 Ferry St
- 162 E Haverhill St
- 80-82 Haverhill St
- 89 Newbury St Unit 89B
- 192 Union St
- 41-43 E Haverhill St
- 91 Summer St Unit 2
- 264 E Haverhill St Unit 2
- 229 Jackson St
- 439-441 High St
- 270 E Haverhill St Unit 12
- 5 Kendrick St
- 106 Leroy Ave
- 32 Josephine Ave
- 39 Swan Ave
- 11 Lawrence St Unit 606
- 265 Howard St Unit 1
- 281 Howard St Unit 283
- 257-259 Howard St
- 257 Howard St Unit 259
- 279 Howard St
- 279 Howard St Unit 3
- 254 Howard St
- 291 Howard St Unit 3
- 291 Howard St Unit 2
- 291 Howard St Unit 1
- 291 Howard St
- 291 Howard St Unit 295
- 264 Howard St
- 286 Howard St
- 34 Pleasant St Unit 34A
- 297 Howard St
- 297 Howard St Unit 1
- 306 Howard St Unit 2
- 301 Howard St
- 38 Pleasant St Unit 40
Your Personal Tour Guide
Ask me questions while you tour the home.