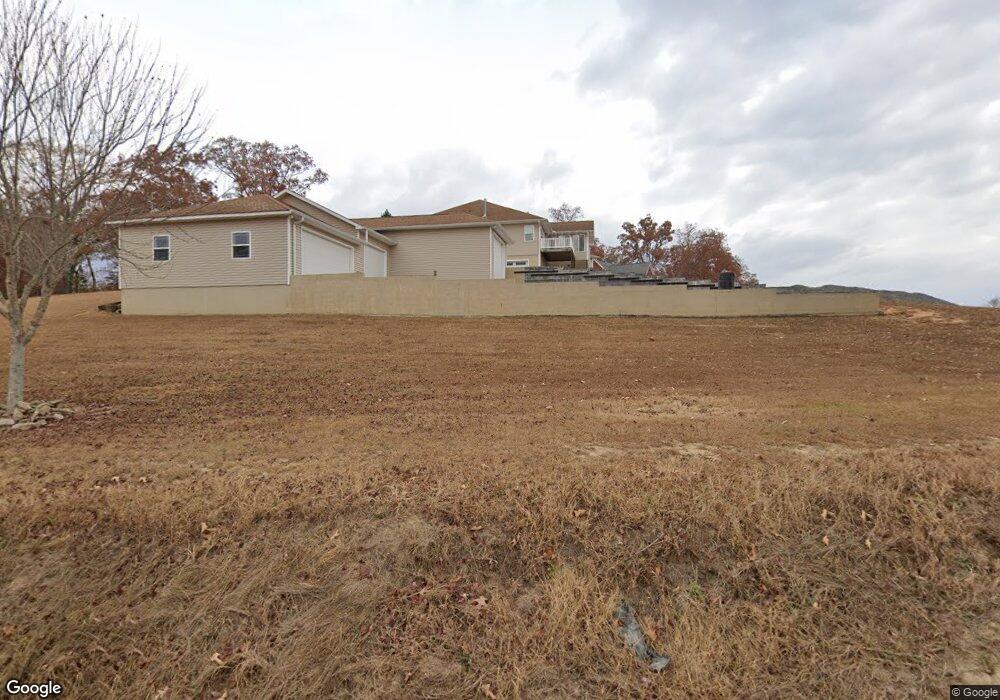
265 Hudlow Rd Dunlap, TN 37327
Estimated Value: $571,000 - $853,000
--
Bed
--
Bath
3,495
Sq Ft
$196/Sq Ft
Est. Value
About This Home
This home is located at 265 Hudlow Rd, Dunlap, TN 37327 and is currently estimated at $686,298, approximately $196 per square foot. 265 Hudlow Rd is a home with nearby schools including Griffith Elementary School, Sequatchie County Middle School, and Sequatchie County High School.
Ownership History
Date
Name
Owned For
Owner Type
Purchase Details
Closed on
Apr 15, 2021
Sold by
Smith Gary A and Smith Nancy L
Bought by
Smith Gary A and Smith Nancy L
Current Estimated Value
Home Financials for this Owner
Home Financials are based on the most recent Mortgage that was taken out on this home.
Original Mortgage
$400,000
Outstanding Balance
$295,638
Interest Rate
2.9%
Mortgage Type
New Conventional
Estimated Equity
$390,660
Purchase Details
Closed on
Mar 26, 2019
Sold by
Smith Gary Arthur and Smith Nancy Lee
Bought by
Gary and Rlt Nancy Smith
Purchase Details
Closed on
Sep 18, 2015
Sold by
Smith Paul J
Bought by
Smith Gary Arthur and O Paul J Smith C
Purchase Details
Closed on
Jan 31, 2006
Sold by
Garner Albert C
Bought by
Arthur Smith Gary
Purchase Details
Closed on
Mar 28, 2005
Sold by
Garner Albert C
Bought by
Mcbee Lori A
Create a Home Valuation Report for This Property
The Home Valuation Report is an in-depth analysis detailing your home's value as well as a comparison with similar homes in the area
Home Values in the Area
Average Home Value in this Area
Purchase History
| Date | Buyer | Sale Price | Title Company |
|---|---|---|---|
| Smith Gary A | -- | Amrock Llc | |
| Smith Gary A | -- | Amrock Llc | |
| Gary | -- | None Available | |
| Smith Gary Arthur | -- | -- | |
| Arthur Smith Gary | $61,800 | -- | |
| Mcbee Lori A | $17,500 | -- |
Source: Public Records
Mortgage History
| Date | Status | Borrower | Loan Amount |
|---|---|---|---|
| Open | Smith Gary A | $400,000 |
Source: Public Records
Tax History Compared to Growth
Tax History
| Year | Tax Paid | Tax Assessment Tax Assessment Total Assessment is a certain percentage of the fair market value that is determined by local assessors to be the total taxable value of land and additions on the property. | Land | Improvement |
|---|---|---|---|---|
| 2025 | $3,077 | $167,550 | $0 | $0 |
| 2024 | $3,077 | $167,550 | $7,525 | $160,025 |
| 2023 | $3,077 | $167,550 | $7,525 | $160,025 |
| 2022 | $2,592 | $106,125 | $7,275 | $98,850 |
| 2021 | $2,592 | $106,125 | $7,275 | $98,850 |
| 2020 | $2,592 | $106,125 | $7,275 | $98,850 |
| 2019 | $2,130 | $87,200 | $7,275 | $79,925 |
| 2018 | $2,130 | $87,200 | $7,275 | $79,925 |
| 2017 | $2,130 | $87,200 | $7,275 | $79,925 |
| 2016 | $2,221 | $86,475 | $7,975 | $78,500 |
| 2015 | $2,221 | $86,475 | $7,975 | $78,500 |
| 2014 | $2,221 | $86,475 | $7,975 | $78,500 |
Source: Public Records
Map
Nearby Homes
- 0 Scenic Hollow Dr
- 1814 Hudlow Loop Rd
- 58 Marilyn Ct
- 0 Hudlow Loop Rd Unit 1523968
- 0 Hudlow Loop Rd Unit 1511092
- 0 Hudlow Loop Rd Unit RTC3045642
- 0 Hudlow Loop 4 1 Ac Rd
- 0 Farmington Creek Rd Unit 1509455
- 0 Neal Rd Unit 1521787
- 152 Highland Dr
- 109 Hidden Ridge Loop
- 235 Highland Dr
- 389 Neal Rd
- 347 Highland Dr
- 90 Riverside Dr
- 0 Hudlow Loop Road 4 1 Acres Unit 20255383
- 0 Hudlow Loop Road 4 1 Acres Unit 240587
- 3 Countryside Dr
- 27 Skyhigh Dr
- 0 Skyhigh Dr Unit 1518263
- 375 Wheeler Ridge Rd
- 0 Covered Bridge Crossing Unit 1106301
- 377 Wheeler Ridge Rd
- 0 Hudlow Rd Unit 1325875
- 0 Hudlow Rd Unit 1328570
- 0 Hudlow Rd Unit 1328571
- 0 Hudlow Rd Unit 1292973
- 0 Hudlow Rd Unit 1234168
- 0 Hudlow Rd Unit 1330325
- 0 Hudlow Rd Unit 1198345
- 0 Hudlow Rd Unit 1198346
- 0 Hudlow Rd Unit 1111414
- 0 Hudlow Rd Unit 1111415
- 0 Hudlow Rd Unit RTC2524602
- 0 Hudlow Rd Unit RTC2525040
- 0 Hudlow Rd Unit RTC2661585
- 0 Hudlow Rd Unit 1103324
- 0 Hudlow Rd Unit RTC2525614
- 0 Hudlow Rd Unit 1115527
- 0 Hudlow Rd Unit 16 1111414