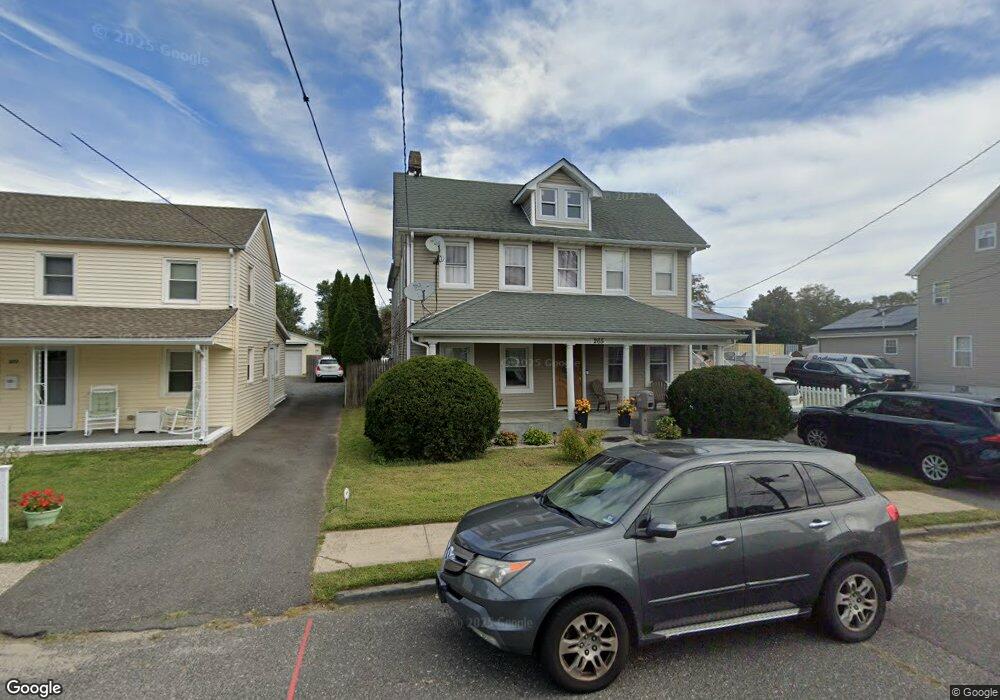
265 Jeffrey St Long Branch, NJ 07740
Estimated Value: $660,000 - $881,000
3
Beds
2
Baths
2,460
Sq Ft
$296/Sq Ft
Est. Value
About This Home
This home is located at 265 Jeffrey St, Long Branch, NJ 07740 and is currently estimated at $728,214, approximately $296 per square foot. 265 Jeffrey St is a home located in Monmouth County with nearby schools including Long Branch High School, Holy Trinity School, and Bet Yaakov of the Jersey Shore.
Ownership History
Date
Name
Owned For
Owner Type
Purchase Details
Closed on
Jun 2, 2016
Sold by
Delacruz Julio A and Delacruz Diva C
Bought by
Delacruz Diva C
Current Estimated Value
Home Financials for this Owner
Home Financials are based on the most recent Mortgage that was taken out on this home.
Original Mortgage
$203,500
Outstanding Balance
$162,907
Interest Rate
3.75%
Mortgage Type
FHA
Estimated Equity
$565,307
Purchase Details
Closed on
Feb 12, 2000
Sold by
Blackwood James
Bought by
Delacruz Julio and Delacruz Diva
Home Financials for this Owner
Home Financials are based on the most recent Mortgage that was taken out on this home.
Original Mortgage
$112,350
Interest Rate
8.15%
Mortgage Type
FHA
Purchase Details
Closed on
Apr 12, 1997
Sold by
Bryan Joseph
Bought by
Blackwood James
Create a Home Valuation Report for This Property
The Home Valuation Report is an in-depth analysis detailing your home's value as well as a comparison with similar homes in the area
Home Values in the Area
Average Home Value in this Area
Purchase History
| Date | Buyer | Sale Price | Title Company |
|---|---|---|---|
| Delacruz Diva C | -- | None Available | |
| Delacruz Julio | $113,300 | -- | |
| Blackwood James | $83,000 | -- |
Source: Public Records
Mortgage History
| Date | Status | Borrower | Loan Amount |
|---|---|---|---|
| Open | Delacruz Diva C | $203,500 | |
| Closed | Delacruz Julio | $112,350 |
Source: Public Records
Tax History Compared to Growth
Tax History
| Year | Tax Paid | Tax Assessment Tax Assessment Total Assessment is a certain percentage of the fair market value that is determined by local assessors to be the total taxable value of land and additions on the property. | Land | Improvement |
|---|---|---|---|---|
| 2025 | $8,584 | $622,900 | $258,000 | $364,900 |
| 2024 | $7,664 | $558,500 | $228,000 | $330,500 |
| 2023 | $7,664 | $493,500 | $178,000 | $315,500 |
| 2022 | $7,202 | $397,900 | $120,000 | $277,900 |
| 2021 | $7,202 | $359,900 | $100,000 | $259,900 |
| 2020 | $7,261 | $347,400 | $89,000 | $258,400 |
| 2019 | $7,071 | $336,400 | $90,000 | $246,400 |
| 2018 | $6,921 | $327,400 | $90,000 | $237,400 |
| 2017 | $6,655 | $322,900 | $90,000 | $232,900 |
| 2016 | $8,036 | $397,600 | $95,000 | $302,600 |
| 2015 | $5,588 | $250,900 | $99,000 | $151,900 |
| 2014 | $5,194 | $245,800 | $111,000 | $134,800 |
Source: Public Records
Map
Nearby Homes
- 144 Westwood Ave
- 170 Franklin Ave
- 237 3rd Ave Unit 1-4
- 158 Franklin Ave
- 152 Franklin Ave
- 150 Franklin Ave Unit 5
- 215 Cleveland Ave
- 145 Stokes Place
- 167 Chelsea Ave
- 166 Franklin Ave Unit 8
- 103 Franklin Ave
- 303 Westwood Ave
- 143 Stokes Place
- 399 Willow Ave
- 14 Slocum Place
- 61 Pavilion Ave
- 364 Westwood Ave Unit 39
- 364 Westwood Ave Unit 71
- 364 Westwood Ave Unit 21
- 377 Westwood Ave
- 277 Jeffrey St
- 259 Jeffrey St
- 279 Jeffrey St
- 273 Jeffrey St
- 255 Jeffrey St
- 267 Jeffrey St
- 253 Jeffrey St
- 269 Jeffrey St
- 266 Jeffrey St
- 270 Jeffrey St
- 262 Jeffrey St
- 278 Jeffrey St
- 283 Jeffrey St
- 184 Westwood Ave
- 280 Jeffrey St
- 287 Jeffrey St
- 174 Cherry St
- 282 Jeffrey St
- 155 Cherry St
- 192 Westwood Ave