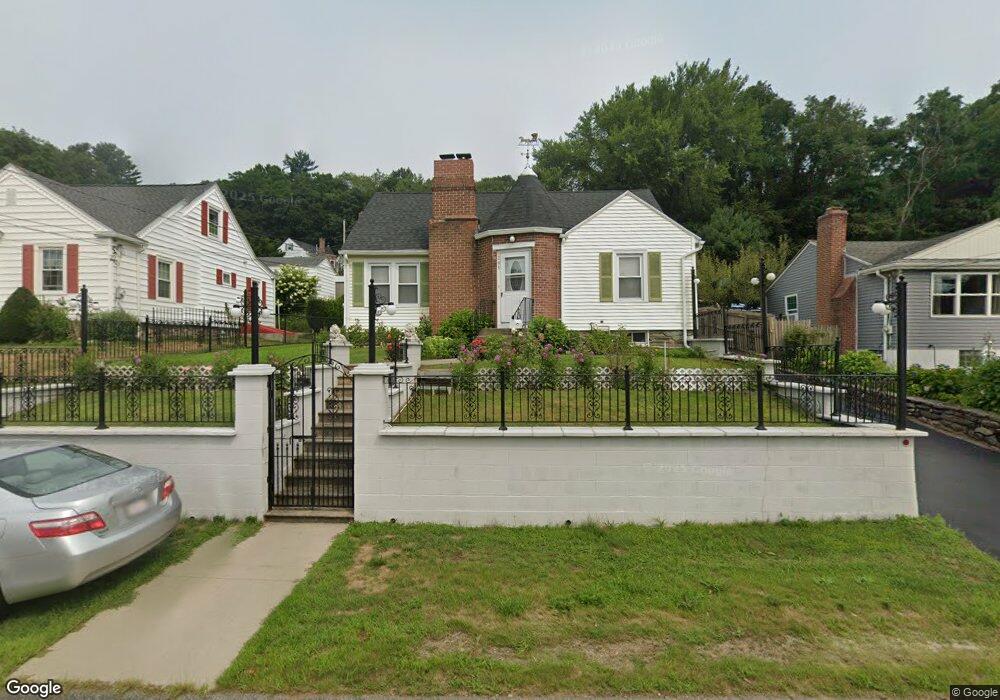
265 June St Worcester, MA 01602
Tatnuck NeighborhoodEstimated Value: $436,000 - $460,000
4
Beds
2
Baths
1,460
Sq Ft
$306/Sq Ft
Est. Value
About This Home
This home is located at 265 June St, Worcester, MA 01602 and is currently estimated at $447,372, approximately $306 per square foot. 265 June St is a home located in Worcester County with nearby schools including Chandler Magnet, Jacob Hiatt Magnet School, and May Street Elementary School.
Ownership History
Date
Name
Owned For
Owner Type
Purchase Details
Closed on
Oct 17, 2022
Sold by
Morava Kujtim and Morava Suzana
Bought by
Morava Bledi and Avxhiu Matilda
Current Estimated Value
Purchase Details
Closed on
Jul 31, 2003
Sold by
Weint Alfred and Weint Lillian
Bought by
Morava Kujtim and Morava Suzana
Home Financials for this Owner
Home Financials are based on the most recent Mortgage that was taken out on this home.
Original Mortgage
$157,600
Interest Rate
5.28%
Mortgage Type
Purchase Money Mortgage
Create a Home Valuation Report for This Property
The Home Valuation Report is an in-depth analysis detailing your home's value as well as a comparison with similar homes in the area
Home Values in the Area
Average Home Value in this Area
Purchase History
| Date | Buyer | Sale Price | Title Company |
|---|---|---|---|
| Morava Bledi | -- | None Available | |
| Morava Kujtim | $197,000 | -- |
Source: Public Records
Mortgage History
| Date | Status | Borrower | Loan Amount |
|---|---|---|---|
| Previous Owner | Morava Kujtim | $157,600 |
Source: Public Records
Tax History Compared to Growth
Tax History
| Year | Tax Paid | Tax Assessment Tax Assessment Total Assessment is a certain percentage of the fair market value that is determined by local assessors to be the total taxable value of land and additions on the property. | Land | Improvement |
|---|---|---|---|---|
| 2025 | $4,710 | $357,100 | $108,900 | $248,200 |
| 2024 | $4,624 | $336,300 | $108,900 | $227,400 |
| 2023 | $4,443 | $309,800 | $94,700 | $215,100 |
| 2022 | $4,088 | $268,800 | $75,800 | $193,000 |
| 2021 | $3,959 | $243,200 | $60,600 | $182,600 |
| 2020 | $3,866 | $227,400 | $60,600 | $166,800 |
| 2019 | $3,688 | $204,900 | $54,500 | $150,400 |
| 2018 | $3,701 | $195,700 | $54,500 | $141,200 |
| 2017 | $3,550 | $184,700 | $54,500 | $130,200 |
| 2016 | $3,533 | $171,400 | $41,100 | $130,300 |
| 2015 | $3,440 | $171,400 | $41,100 | $130,300 |
| 2014 | $3,349 | $171,400 | $41,100 | $130,300 |
Source: Public Records
Map
Nearby Homes