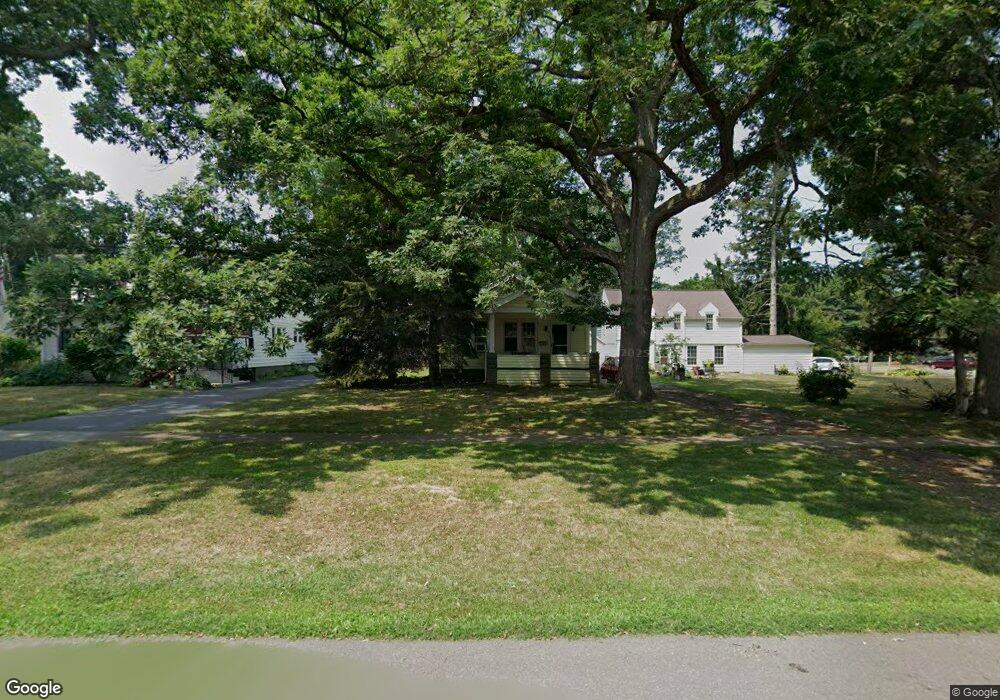
265 N 3rd St Lewiston, NY 14092
Estimated Value: $217,000 - $276,000
2
Beds
1
Bath
996
Sq Ft
$244/Sq Ft
Est. Value
About This Home
This home is located at 265 N 3rd St, Lewiston, NY 14092 and is currently estimated at $242,796, approximately $243 per square foot. 265 N 3rd St is a home located in Niagara County with nearby schools including Primary Education Center, Intermediate Education Center, and Lewiston Porter Middle School.
Ownership History
Date
Name
Owned For
Owner Type
Purchase Details
Closed on
Nov 27, 2009
Sold by
Palumbo Leonard J
Bought by
Nocera Joseph S
Current Estimated Value
Home Financials for this Owner
Home Financials are based on the most recent Mortgage that was taken out on this home.
Original Mortgage
$102,834
Outstanding Balance
$67,452
Interest Rate
5.01%
Mortgage Type
New Conventional
Estimated Equity
$175,344
Purchase Details
Closed on
Dec 31, 2008
Sold by
Helfrich Robert-Estate
Bought by
Palumbo Leonard
Purchase Details
Closed on
Nov 16, 2007
Sold by
Helfrich Isabel
Bought by
Helfrich Robert
Create a Home Valuation Report for This Property
The Home Valuation Report is an in-depth analysis detailing your home's value as well as a comparison with similar homes in the area
Home Values in the Area
Average Home Value in this Area
Purchase History
| Date | Buyer | Sale Price | Title Company |
|---|---|---|---|
| Nocera Joseph S | $108,247 | None Available | |
| Palumbo Leonard | $77,800 | Thomas Augello | |
| Helfrich Robert | -- | Gary Billingsley |
Source: Public Records
Mortgage History
| Date | Status | Borrower | Loan Amount |
|---|---|---|---|
| Open | Nocera Joseph S | $102,834 |
Source: Public Records
Tax History Compared to Growth
Tax History
| Year | Tax Paid | Tax Assessment Tax Assessment Total Assessment is a certain percentage of the fair market value that is determined by local assessors to be the total taxable value of land and additions on the property. | Land | Improvement |
|---|---|---|---|---|
| 2024 | $3,569 | $75,300 | $13,400 | $61,900 |
| 2023 | $3,569 | $75,300 | $13,400 | $61,900 |
| 2022 | $3,527 | $75,300 | $13,400 | $61,900 |
| 2021 | $3,491 | $75,300 | $13,400 | $61,900 |
| 2020 | $2,965 | $75,300 | $13,400 | $61,900 |
| 2019 | $2,737 | $75,300 | $13,400 | $61,900 |
| 2018 | $2,802 | $75,300 | $13,400 | $61,900 |
| 2017 | $2,737 | $75,300 | $13,400 | $61,900 |
| 2016 | $2,725 | $75,300 | $13,400 | $61,900 |
| 2015 | -- | $75,300 | $13,400 | $61,900 |
| 2014 | -- | $75,300 | $13,400 | $61,900 |
Source: Public Records
Map
Nearby Homes