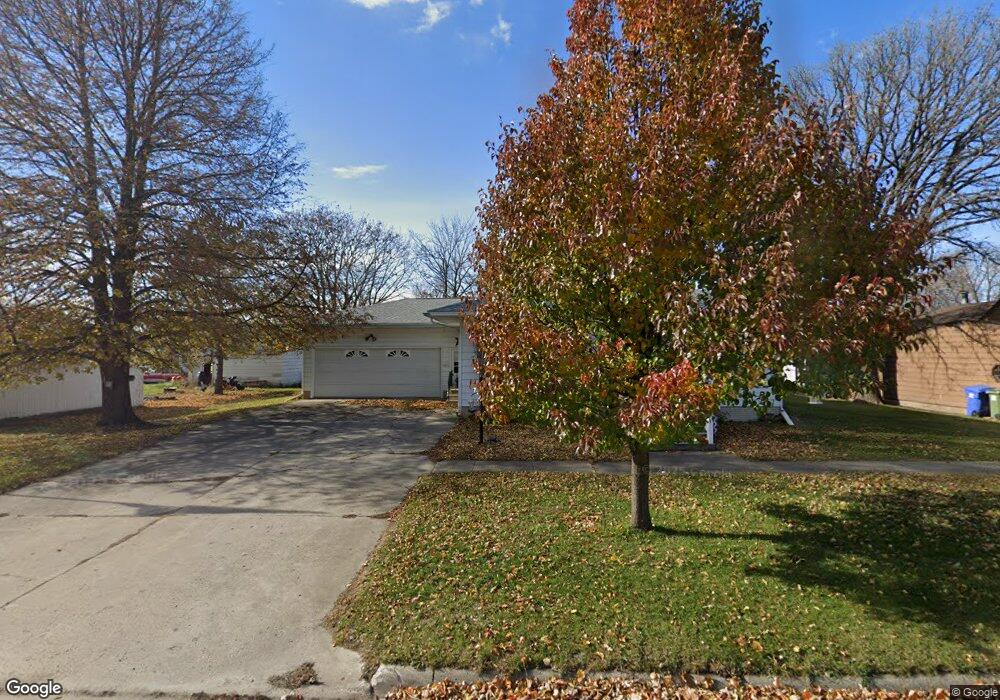
265 Pine St Allison, IA 50602
Estimated Value: $158,000 - $187,000
2
Beds
2
Baths
1,408
Sq Ft
$119/Sq Ft
Est. Value
About This Home
This home is located at 265 Pine St, Allison, IA 50602 and is currently estimated at $167,505, approximately $118 per square foot. 265 Pine St is a home with nearby schools including North Butler Elementary and North Butler Junior/Senior High School.
Ownership History
Date
Name
Owned For
Owner Type
Purchase Details
Closed on
May 2, 2022
Sold by
Kuehner David A
Bought by
Kluiter Dallas E and Kluiter Rita R
Current Estimated Value
Home Financials for this Owner
Home Financials are based on the most recent Mortgage that was taken out on this home.
Original Mortgage
$126,400
Outstanding Balance
$119,382
Interest Rate
5.1%
Mortgage Type
New Conventional
Estimated Equity
$48,123
Create a Home Valuation Report for This Property
The Home Valuation Report is an in-depth analysis detailing your home's value as well as a comparison with similar homes in the area
Purchase History
| Date | Buyer | Sale Price | Title Company |
|---|---|---|---|
| Kluiter Dallas E | $175,000 | None Listed On Document |
Source: Public Records
Mortgage History
| Date | Status | Borrower | Loan Amount |
|---|---|---|---|
| Open | Kluiter Dallas E | $126,400 |
Source: Public Records
Tax History
| Year | Tax Paid | Tax Assessment Tax Assessment Total Assessment is a certain percentage of the fair market value that is determined by local assessors to be the total taxable value of land and additions on the property. | Land | Improvement |
|---|---|---|---|---|
| 2025 | $2,518 | $169,400 | $14,850 | $154,550 |
| 2024 | $2,518 | $168,500 | $14,850 | $153,650 |
| 2023 | $2,262 | $148,290 | $14,850 | $133,440 |
| 2022 | $2,148 | $125,510 | $14,850 | $110,660 |
| 2021 | $2,094 | $125,510 | $14,850 | $110,660 |
| 2020 | $2,094 | $112,590 | $14,850 | $97,740 |
| 2019 | $1,918 | $103,710 | $14,850 | $97,740 |
| 2018 | $2,042 | $103,710 | $0 | $0 |
| 2017 | $2,042 | $103,710 | $0 | $0 |
| 2016 | $1,952 | $96,510 | $0 | $0 |
| 2015 | $1,952 | $96,510 | $0 | $0 |
| 2014 | $1,930 | $96,510 | $0 | $0 |
Source: Public Records
Map
Nearby Homes
Your Personal Tour Guide
Ask me questions while you tour the home.