F
Seller's Agent in 2015
Fontaine Taylor
Crye-Leike
Estimated Value: $309,000 - $330,000
Please note, our homes are available on a first-come, first-serve basis and are not reserved until the holding fee agreement is signed and the holding fee is paid by the primary applicant.
This home features Progress Smart Home - Progress Residential's smart home app, which allows you to control the home securely from any of your devices. Learn more at
This home is priced to rent and won't be around for long. Apply now, while the current residents are preparing to move out, or call to arrange a meeting with your local Progress Residential leasing specialist today.
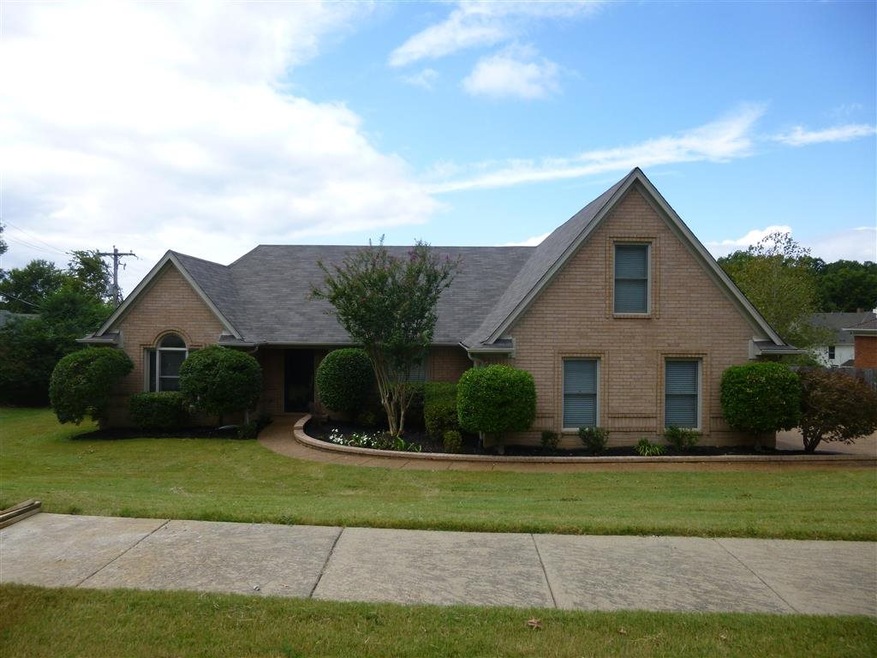
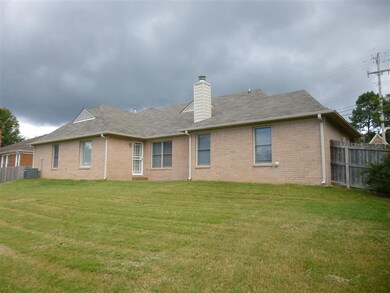
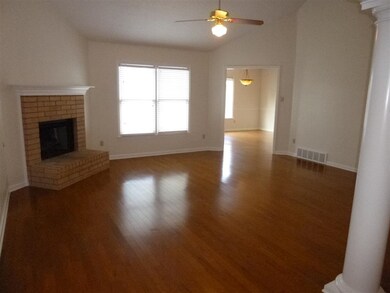
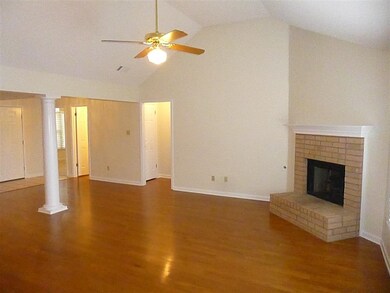
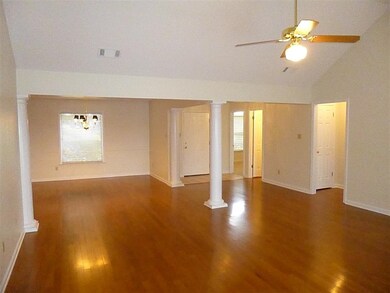
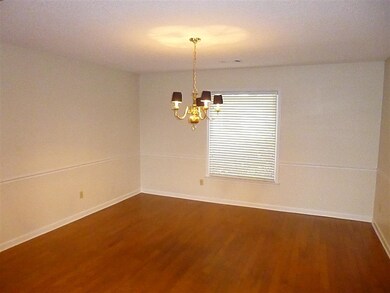
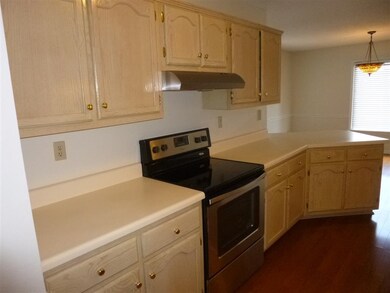
This Cordova rental home holds an impressive four bedrooms and two bathrooms in 2,271 square feet of space. Enter a great open-plan space with the dining room, living room, breakfast nook, and kitchen. The large living room sports a corner fireplace with a raised hearth, a ceiling fan light, and beautiful flooring while the breakfast nook door opens to the backyard. The kitchen gives you lots of counter space and a double sink, making meal preparation and cleanup easier. You'll love the size of the main bedroom and both the size and privacy of the en-suite bedroom which has a glamorous tub, two vanities, a walk-in shower, and a walk-in closet. Don't wait to apply for this home.
| Date | Buyer | Sale Price | Title Company |
|---|---|---|---|
| Freo Tennessee Llc | $135,000 | Realty Title & Escrow Co |
| Date | Event | Price | Change | Sq Ft Price |
|---|---|---|---|---|
| 03/15/2025 03/15/25 | Off Market | $2,135 | -- | -- |
| 03/10/2025 03/10/25 | Price Changed | $2,135 | -0.9% | $1 / Sq Ft |
| 03/08/2025 03/08/25 | Price Changed | $2,155 | +0.5% | $1 / Sq Ft |
| 03/07/2025 03/07/25 | Price Changed | $2,145 | -0.7% | $1 / Sq Ft |
| 03/06/2025 03/06/25 | Price Changed | $2,160 | -1.8% | $1 / Sq Ft |
| 03/05/2025 03/05/25 | Price Changed | $2,200 | -0.5% | $1 / Sq Ft |
| 03/05/2025 03/05/25 | Price Changed | $2,210 | +0.9% | $1 / Sq Ft |
| 03/02/2025 03/02/25 | Price Changed | $2,190 | -0.5% | $1 / Sq Ft |
| 03/01/2025 03/01/25 | Price Changed | $2,200 | +3.5% | $1 / Sq Ft |
| 02/10/2025 02/10/25 | Price Changed | $2,125 | +0.2% | $1 / Sq Ft |
| 02/09/2025 02/09/25 | Price Changed | $2,120 | -0.7% | $1 / Sq Ft |
| 02/08/2025 02/08/25 | Price Changed | $2,135 | -0.5% | $1 / Sq Ft |
| 02/06/2025 02/06/25 | Price Changed | $2,145 | +0.7% | $1 / Sq Ft |
| 02/06/2025 02/06/25 | Price Changed | $2,130 | -0.2% | $1 / Sq Ft |
| 01/25/2025 01/25/25 | For Rent | $2,135 | +52.5% | -- |
| 11/06/2015 11/06/15 | Rented | $1,400 | 0.0% | -- |
| 10/12/2015 10/12/15 | Under Contract | -- | -- | -- |
| 09/30/2015 09/30/15 | For Rent | $1,400 | 0.0% | -- |
| 08/11/2015 08/11/15 | Sold | $135,000 | -9.1% | $61 / Sq Ft |
| 07/09/2015 07/09/15 | Pending | -- | -- | -- |
| 07/06/2015 07/06/15 | For Sale | $148,500 | -- | $68 / Sq Ft |
| Year | Tax Paid | Tax Assessment Tax Assessment Total Assessment is a certain percentage of the fair market value that is determined by local assessors to be the total taxable value of land and additions on the property. | Land | Improvement |
|---|---|---|---|---|
| 2025 | $1,976 | $76,975 | $15,250 | $61,725 |
| 2024 | $1,976 | $58,275 | $9,525 | $48,750 |
| 2023 | $1,976 | $58,275 | $9,525 | $48,750 |
| 2022 | $1,976 | $58,275 | $9,525 | $48,750 |
| 2021 | $2,010 | $58,275 | $9,525 | $48,750 |
F
Seller's Agent in 2015
Fontaine Taylor
Crye-Leike
K
Landlord's Agent in 2015
Kim Love
Crye-Leike
(901) 598-0673

Buyer's Agent in 2015
Terri Porter
The Porter Group
(901) 870-0927
9 in this area
164 Total Sales
Source: Memphis Area Association of REALTORS®
MLS Number: 9962205
APN: D0-220V-E0-0085
Disclaimer: Certain information contained herein is derived from information provided by parties other than Homes.com. All information provided is deemed reliable, but is not guaranteed to be accurate and should be independently verified.
![]() IDX information is provided exclusively for personal, non-commercial use, and may not be used for any purpose other than to identify prospective properties consumers may be interested in purchasing.
IDX information is provided exclusively for personal, non-commercial use, and may not be used for any purpose other than to identify prospective properties consumers may be interested in purchasing.
Information is deemed reliable but not guaranteed.
Some or all of the listings displayed may not belong to the firm whose website is being visited. Copyright© 2025 Memphis Area Association of REALTORS®.