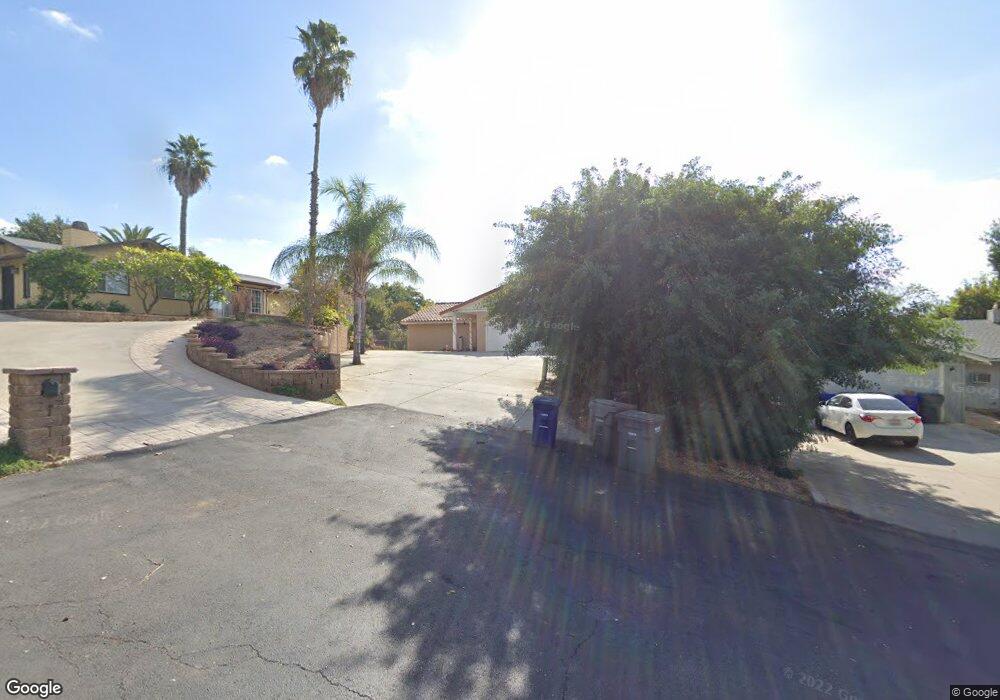
265 Via Cassandra Fallbrook, CA 92028
Estimated Value: $655,000 - $766,000
3
Beds
2
Baths
1,716
Sq Ft
$417/Sq Ft
Est. Value
About This Home
This home is located at 265 Via Cassandra, Fallbrook, CA 92028 and is currently estimated at $716,080, approximately $417 per square foot. 265 Via Cassandra is a home located in San Diego County with nearby schools including La Paloma Elementary School, James E. Potter Intermediate School, and Fallbrook High School.
Ownership History
Date
Name
Owned For
Owner Type
Purchase Details
Closed on
Aug 24, 2012
Sold by
Mendoza Juan D and Mendoza Ana Maria
Bought by
Mendoza Nathaly and The Paloma 2012 Irrevocable Trust
Current Estimated Value
Purchase Details
Closed on
Jun 3, 2005
Sold by
Hale Nikki
Bought by
Mendoza Juan D and Mendoza Ana
Home Financials for this Owner
Home Financials are based on the most recent Mortgage that was taken out on this home.
Original Mortgage
$359,200
Interest Rate
2%
Mortgage Type
Negative Amortization
Purchase Details
Closed on
Dec 28, 1993
Sold by
Hale Claude C
Bought by
Hale Claude C and Hale Nikki
Create a Home Valuation Report for This Property
The Home Valuation Report is an in-depth analysis detailing your home's value as well as a comparison with similar homes in the area
Home Values in the Area
Average Home Value in this Area
Purchase History
| Date | Buyer | Sale Price | Title Company |
|---|---|---|---|
| Mendoza Nathaly | -- | None Available | |
| Mendoza Juan D | $449,000 | First American Title | |
| Hale Claude C | -- | -- |
Source: Public Records
Mortgage History
| Date | Status | Borrower | Loan Amount |
|---|---|---|---|
| Previous Owner | Mendoza Juan D | $359,200 |
Source: Public Records
Tax History
| Year | Tax Paid | Tax Assessment Tax Assessment Total Assessment is a certain percentage of the fair market value that is determined by local assessors to be the total taxable value of land and additions on the property. | Land | Improvement |
|---|---|---|---|---|
| 2025 | $6,524 | $619,986 | $348,044 | $271,942 |
| 2024 | $6,524 | $607,830 | $341,220 | $266,610 |
| 2023 | $6,331 | $595,913 | $334,530 | $261,383 |
| 2022 | $6,333 | $584,229 | $327,971 | $256,258 |
| 2021 | $5,453 | $510,000 | $213,000 | $297,000 |
| 2020 | $5,065 | $465,000 | $195,000 | $270,000 |
| 2019 | $4,847 | $445,000 | $187,000 | $258,000 |
| 2018 | $4,760 | $435,000 | $183,000 | $252,000 |
| 2017 | $4,379 | $400,000 | $169,000 | $231,000 |
| 2016 | $3,814 | $350,000 | $148,000 | $202,000 |
| 2015 | $3,487 | $320,000 | $136,000 | $184,000 |
| 2014 | $3,057 | $280,000 | $120,000 | $160,000 |
Source: Public Records
Map
Nearby Homes
- 206 Via Oro Verde
- 139-41 Almond St
- 0 Laurine Ln
- 1735 S Mission Rd
- 0 Mission Rd Unit None
- 0 Mission Rd Unit NDP2602506
- 0 Mission Rd Unit IG25148608
- 0 Mission Rd Unit NDP2506959
- 445 Poets Square
- 1024 Kiel Rd
- 190 Mission Oaks Rd
- 929 Pepper Tree Ln
- 1304 Farrand Rd
- 1003 Via Unidos
- 1027 Pepper Tree Ln
- 1455 Alturas Rd Unit 46
- 1455 Alturas Rd Unit 89
- 1134 McDonald Rd
- 710 Greyfield Ct
- 721 Highland Park
- 267 Via Cassandra
- 257 Via Cassandra
- 1557 Emerald Ridge Rd
- 312 Palomino Rd
- 316 Palomino Rd
- 1549 Emerald Ridge Rd
- 268 Via Cassandra
- 1565 Emerald Ridge Rd
- 249 Via Cassandra
- 210 Palomino Rd
- 318 Palomino Rd
- 256 Via Cassandra
- 1541 Emerald Ridge Rd
- 262 Via Cassandra
- 1573 Emerald Ridge Rd
- 1537 Emerald Ridge Rd
- 231 Via Cassandra
- 248 Via Cassandra
- 1533 Emerald Ridge Rd
- 236 Via Cassandra
Your Personal Tour Guide
Ask me questions while you tour the home.