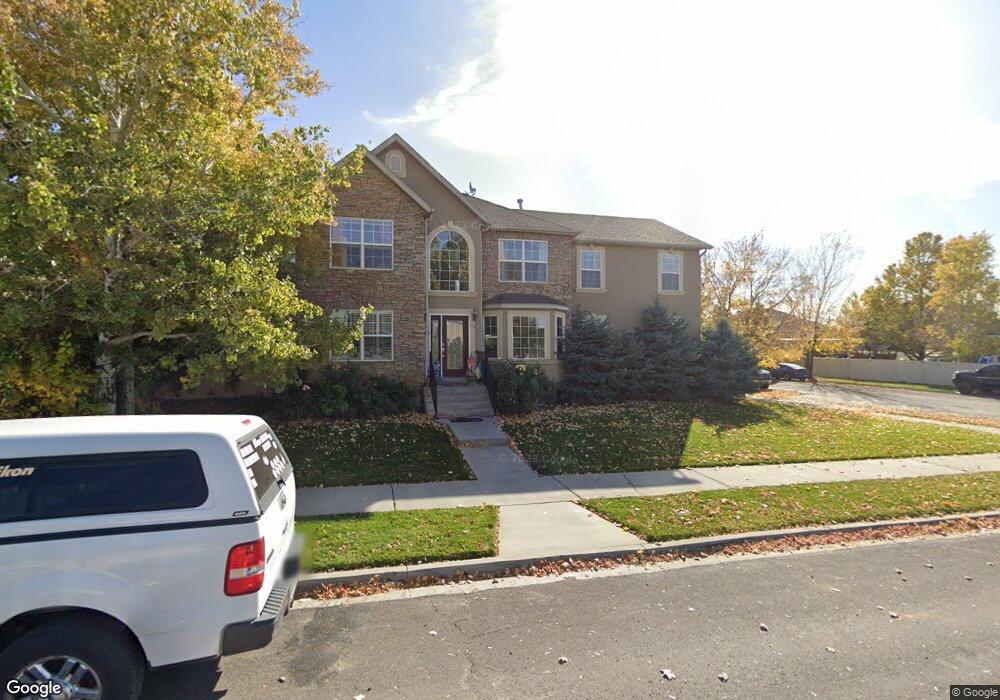
265 W 1650 S Payson, UT 84651
Estimated Value: $515,000 - $668,000
3
Beds
3
Baths
2,492
Sq Ft
$239/Sq Ft
Est. Value
About This Home
This home is located at 265 W 1650 S, Payson, UT 84651 and is currently estimated at $595,734, approximately $239 per square foot. 265 W 1650 S is a home located in Utah County with nearby schools including Spring Lake Elementary, Payson High School, and Payson Junior High School.
Ownership History
Date
Name
Owned For
Owner Type
Purchase Details
Closed on
Nov 17, 2003
Sold by
Olsen Eric M
Bought by
Olsen Eric M and Minnette Olsen L
Current Estimated Value
Purchase Details
Closed on
Aug 29, 2002
Sold by
Olsen Eric M and Olsen Leah Minnette
Bought by
Olsen Eric M
Purchase Details
Closed on
Jan 1, 2002
Sold by
Olsen Eric M
Bought by
Olsen Eric M and Olsen Leah Minnette
Purchase Details
Closed on
Feb 22, 2001
Sold by
Dayton Enterprises Inc
Bought by
Wasatch Development & Finance Llc
Home Financials for this Owner
Home Financials are based on the most recent Mortgage that was taken out on this home.
Original Mortgage
$168,000
Outstanding Balance
$59,821
Interest Rate
6.89%
Mortgage Type
Construction
Estimated Equity
$535,913
Purchase Details
Closed on
Feb 16, 2001
Sold by
Wasatch Development & Finance Llc
Bought by
Olsen Eric M
Home Financials for this Owner
Home Financials are based on the most recent Mortgage that was taken out on this home.
Original Mortgage
$168,000
Outstanding Balance
$59,821
Interest Rate
6.89%
Mortgage Type
Construction
Estimated Equity
$535,913
Create a Home Valuation Report for This Property
The Home Valuation Report is an in-depth analysis detailing your home's value as well as a comparison with similar homes in the area
Home Values in the Area
Average Home Value in this Area
Purchase History
| Date | Buyer | Sale Price | Title Company |
|---|---|---|---|
| Olsen Eric M | -- | -- | |
| Olsen Eric M | -- | Titlewriters Inc | |
| Olsen Eric M | -- | Guardian Title Ins Agency | |
| Wasatch Development & Finance Llc | -- | First American Title Co | |
| Olsen Eric M | -- | First American Title Co |
Source: Public Records
Mortgage History
| Date | Status | Borrower | Loan Amount |
|---|---|---|---|
| Open | Olsen Eric M | $168,000 | |
| Closed | Olsen Eric M | $12,500 |
Source: Public Records
Tax History Compared to Growth
Tax History
| Year | Tax Paid | Tax Assessment Tax Assessment Total Assessment is a certain percentage of the fair market value that is determined by local assessors to be the total taxable value of land and additions on the property. | Land | Improvement |
|---|---|---|---|---|
| 2025 | $2,744 | $296,175 | $175,300 | $363,200 |
| 2024 | $2,744 | $279,235 | $0 | $0 |
| 2023 | $2,815 | $287,320 | $0 | $0 |
| 2022 | $2,870 | $288,090 | $0 | $0 |
| 2021 | $2,435 | $392,000 | $115,100 | $276,900 |
| 2020 | $2,310 | $363,900 | $104,600 | $259,300 |
| 2019 | $2,142 | $345,900 | $86,600 | $259,300 |
| 2018 | $2,141 | $333,200 | $75,800 | $257,400 |
| 2017 | $1,921 | $160,820 | $0 | $0 |
| 2016 | $1,751 | $145,585 | $0 | $0 |
| 2015 | $1,562 | $129,030 | $0 | $0 |
| 2014 | $1,424 | $118,470 | $0 | $0 |
Source: Public Records
Map
Nearby Homes
- 32 E 1690 S
- 32 E 1690 S Unit 113
- 44 W 1690 S Unit 109
- 1567 Spur Ct
- 211 W 1800 S
- 1825 S 410 W
- 1632 S 240 W Unit 47
- 1652 S 240 W Unit 48
- 1856 S 410 W
- 598 W Saddlebrook Dr
- 1868 S 410 W
- 1872 100 E Unit 6
- 480 W 1890 S
- The Aurora Plan at Payson View South
- The McKenzie Plan at Payson View South
- The Elizabeth Plan at Payson View South
- The Christine Plan at Payson View South
- The Kaitlyn Plan at Payson View South
- The Autumn Plan at Payson View South
- The Avery Plan at Payson View South
- 241 W 1650 S
- 252 W 1690 S Unit SM06A
- 252 W 1690 S
- 204 W 1690 S Unit SM05A
- 295 W 1650 S
- 258 W 1650 S
- 275 W 1650 S
- 316 W 1690 S
- 227 W 1650 S
- 234 W 1650 S
- 158 W 1690 S Unit SM04A
- 298 W 1650 S
- 325 W 1650 S
- 358 W 1690 S Unit 20
- 358 W 1690 S
- 267 W 1690 S
- 263 W 1600 S
- 263 W 1600 S Unit 29
- 208 W 1650 S
- 213 W 1690 S Unit SM 10A