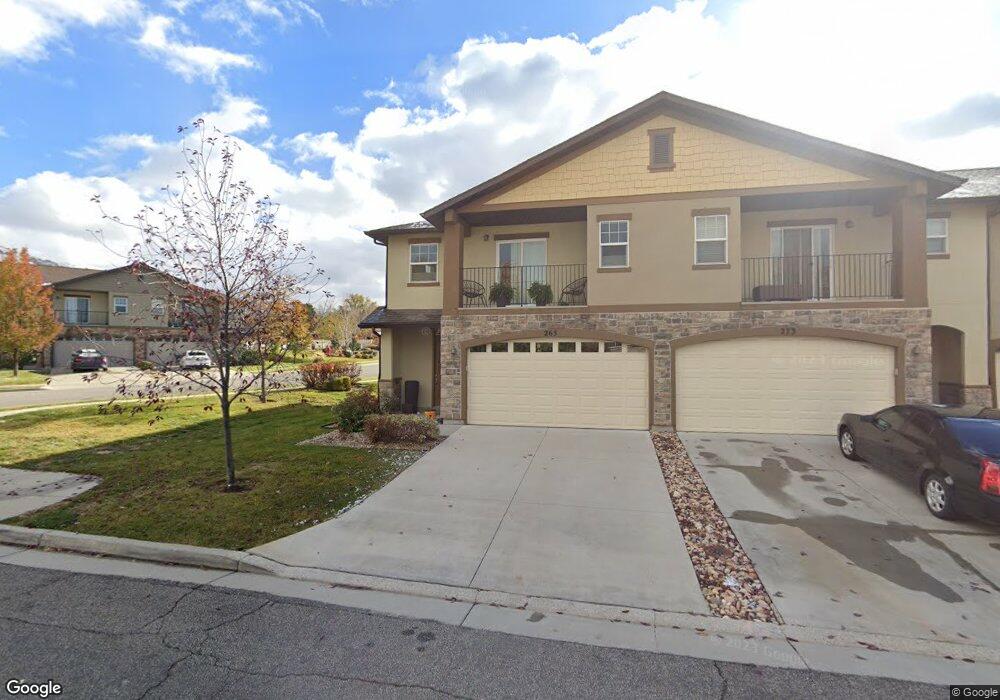
265 W 680 N Centerville, UT 84014
Estimated Value: $456,000 - $474,000
3
Beds
2
Baths
1,785
Sq Ft
$261/Sq Ft
Est. Value
About This Home
This home is located at 265 W 680 N, Centerville, UT 84014 and is currently estimated at $465,711, approximately $260 per square foot. 265 W 680 N is a home located in Davis County with nearby schools including Centerville Elementary, Centerville Jr High, and Viewmont High School.
Ownership History
Date
Name
Owned For
Owner Type
Purchase Details
Closed on
Sep 23, 2010
Sold by
Thomas Charles M and Thomas Suzette
Bought by
Thomas Charles M and Thomas Suzette
Current Estimated Value
Home Financials for this Owner
Home Financials are based on the most recent Mortgage that was taken out on this home.
Original Mortgage
$245,544
Outstanding Balance
$164,672
Interest Rate
4.75%
Mortgage Type
FHA
Estimated Equity
$301,039
Purchase Details
Closed on
Jan 15, 2009
Sold by
Thomas Charles M and Thomas Suzette
Bought by
Thomas Charles M and Thomas Suzette
Home Financials for this Owner
Home Financials are based on the most recent Mortgage that was taken out on this home.
Original Mortgage
$246,620
Interest Rate
5.6%
Mortgage Type
FHA
Create a Home Valuation Report for This Property
The Home Valuation Report is an in-depth analysis detailing your home's value as well as a comparison with similar homes in the area
Purchase History
We collect this data history from publicly available records. To have your information removed, we recommend requesting removal directly through your county’s website.
| Date | Buyer | Sale Price | Title Company |
|---|---|---|---|
| Thomas Charles M | -- | Backman Title Service | |
| Thomas Charles M | -- | Mountain View Title | |
| Thomas Charles M | -- | Mountain View Title |
Source: Public Records
Mortgage History
We collect this data history from publicly available records. To have your information removed, we recommend requesting removal directly through your county’s website.
| Date | Status | Borrower | Loan Amount |
|---|---|---|---|
| Open | Thomas Charles M | $245,544 | |
| Closed | Thomas Charles M | $246,620 |
Source: Public Records
Tax History
| Year | Tax Paid | Tax Assessment Tax Assessment Total Assessment is a certain percentage of the fair market value that is determined by local assessors to be the total taxable value of land and additions on the property. | Land | Improvement |
|---|---|---|---|---|
| 2025 | $2,501 | $239,250 | $72,050 | $167,200 |
| 2024 | $2,397 | $233,200 | $55,000 | $178,200 |
| 2023 | $2,463 | $433,000 | $98,000 | $335,000 |
| 2022 | $2,483 | $240,350 | $52,800 | $187,550 |
| 2021 | $2,222 | $335,000 | $69,000 | $266,000 |
| 2020 | $1,977 | $298,000 | $64,500 | $233,500 |
| 2019 | $1,963 | $289,000 | $62,000 | $227,000 |
| 2018 | $1,746 | $254,000 | $58,000 | $196,000 |
| 2016 | $1,409 | $113,905 | $15,015 | $98,890 |
| 2015 | $1,338 | $102,025 | $15,015 | $87,010 |
| 2014 | $1,316 | $102,705 | $15,015 | $87,690 |
| 2013 | -- | $106,750 | $15,015 | $91,735 |
Source: Public Records
Map
Nearby Homes
- 281 W 650 N Unit B
- 282 W 605 N Unit A
- 282 W 605 N Unit I
- 165 W Pheasantbrook Dr
- 66 Brookside Ln
- 523 Mountain View Rd
- 507 W 620 N
- 914 N 400 W
- 610 N Main St
- 527 W 620 N Unit 133
- 271 Brookfield Ln
- 871 Bonita Way
- 257 W 1125 N
- 371 W 1125 N
- 243 Balsam Dr
- 83 W 200 N
- 185 N 50 W
- 147 N 360 W Unit 21
- 1166 N 700 W
- 1167 Deerfield Dr
Your Personal Tour Guide
Ask me questions while you tour the home.