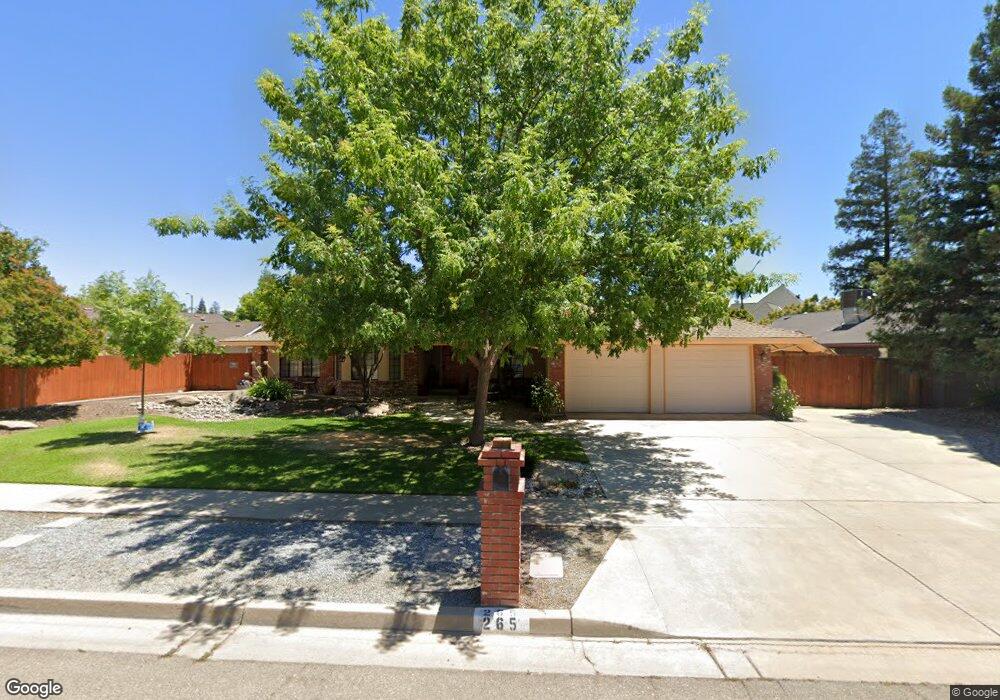
265 W Teague Ave Fresno, CA 93711
Bullard NeighborhoodEstimated Value: $506,000 - $570,000
3
Beds
2
Baths
1,826
Sq Ft
$298/Sq Ft
Est. Value
About This Home
This home is located at 265 W Teague Ave, Fresno, CA 93711 and is currently estimated at $543,284, approximately $297 per square foot. 265 W Teague Ave is a home located in Fresno County with nearby schools including Pinedale Elementary School, Kastner Intermediate School, and Clovis West High School.
Ownership History
Date
Name
Owned For
Owner Type
Purchase Details
Closed on
Jan 30, 2018
Sold by
Collins Melvin and Collins Linda
Bought by
Collins Melvin and Collins Linda
Current Estimated Value
Purchase Details
Closed on
May 10, 2004
Sold by
Vanderford Brenda B
Bought by
Collins Melvin and Collins Linda
Home Financials for this Owner
Home Financials are based on the most recent Mortgage that was taken out on this home.
Original Mortgage
$238,400
Outstanding Balance
$115,068
Interest Rate
5.92%
Mortgage Type
Purchase Money Mortgage
Estimated Equity
$428,216
Purchase Details
Closed on
Jun 26, 2001
Sold by
Groppetti Teresa Hunger and Hunger Teresa
Bought by
Vanderford Brenda B
Home Financials for this Owner
Home Financials are based on the most recent Mortgage that was taken out on this home.
Original Mortgage
$149,600
Interest Rate
7.15%
Purchase Details
Closed on
Apr 4, 1995
Sold by
Hutchison Don H and Hutchison Henrietta M
Bought by
Hunger Teresa
Home Financials for this Owner
Home Financials are based on the most recent Mortgage that was taken out on this home.
Original Mortgage
$136,800
Interest Rate
6.12%
Create a Home Valuation Report for This Property
The Home Valuation Report is an in-depth analysis detailing your home's value as well as a comparison with similar homes in the area
Home Values in the Area
Average Home Value in this Area
Purchase History
| Date | Buyer | Sale Price | Title Company |
|---|---|---|---|
| Collins Melvin | -- | None Available | |
| Collins Melvin | $298,000 | Chicago Title Company | |
| Vanderford Brenda B | $187,000 | Chicago Title Co | |
| Hunger Teresa | $152,000 | Fidelity National Title Ins |
Source: Public Records
Mortgage History
| Date | Status | Borrower | Loan Amount |
|---|---|---|---|
| Open | Collins Melvin | $238,400 | |
| Previous Owner | Vanderford Brenda B | $149,600 | |
| Previous Owner | Hunger Teresa | $136,800 | |
| Closed | Vanderford Brenda B | $28,050 |
Source: Public Records
Tax History Compared to Growth
Tax History
| Year | Tax Paid | Tax Assessment Tax Assessment Total Assessment is a certain percentage of the fair market value that is determined by local assessors to be the total taxable value of land and additions on the property. | Land | Improvement |
|---|---|---|---|---|
| 2025 | $5,295 | $451,549 | $69,655 | $381,894 |
| 2023 | $5,295 | $434,016 | $66,951 | $367,065 |
| 2022 | $5,121 | $425,507 | $65,639 | $359,868 |
| 2021 | $4,656 | $390,500 | $165,000 | $225,500 |
| 2020 | $4,254 | $355,000 | $150,000 | $205,000 |
| 2019 | $3,853 | $321,900 | $120,000 | $201,900 |
| 2018 | $3,733 | $312,700 | $116,600 | $196,100 |
| 2017 | $3,527 | $295,000 | $110,000 | $185,000 |
| 2016 | $3,357 | $285,000 | $110,000 | $175,000 |
| 2015 | $3,408 | $289,400 | $44,500 | $244,900 |
| 2014 | $3,193 | $271,100 | $41,700 | $229,400 |
Source: Public Records
Map
Nearby Homes
- 8418 N Del Mar Ave
- 8282 N College Ave
- 8237 N Del Mar Ave
- 8298 N Calaveras St
- 218 W Hubert Ct
- 242 W Hubert Ct
- 204 W Bluff Ave
- 8052 N Mariposa St
- 315 E Nees Ave Unit 155
- 9360 N 9360 N Blackstone Ave Unit 201
- 264 E Loyola Ave
- 381 E Nees Ave Unit 133
- 9360 N Blackstone Ave Unit 116
- 9360 N Blackstone Ave Unit 243
- 9360 N Blackstone Ave Unit 213
- 9360 N Blackstone Ave Unit 107
- 9360 N Blackstone Ave Unit 238
- 9360 N Blackstone Ave Unit 236
- 9360 N Blackstone Ave Unit 135
- 7676 N Fresno St Unit 20
- 271 W Teague Ave
- 8481 N Poplar Ave
- 8435 N Poplar Ave
- 8421 N Poplar Ave
- 262 W Teague Ave
- 277 W Teague Ave
- 266 W Teague Ave
- 258 W Teague Ave
- 272 W Teague Ave
- 254 W Teague Ave
- 8450 N Poplar Ave
- 8466 N Poplar Ave
- 8389 N Poplar Ave
- 8432 N Poplar Ave
- 278 W Teague Ave
- 245 W Teague Ave
- 281 W Teague Ave
- 274 W Quincy Ave
- 299 W Audubon Dr
- 248 W Teague Ave