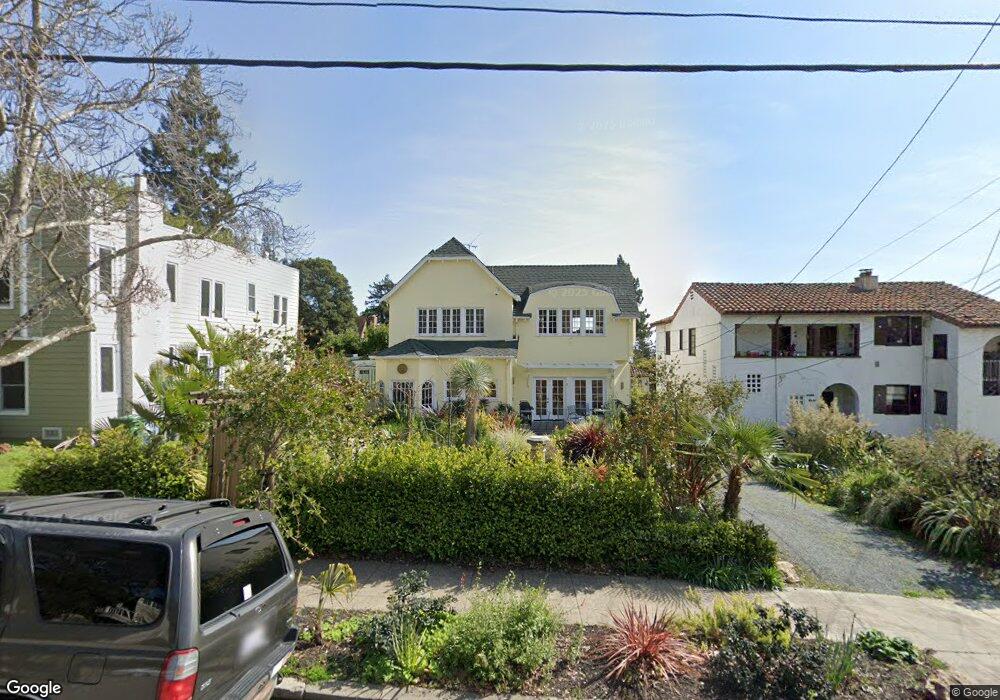
2650 Hilgard Ave Berkeley, CA 94709
North Berkeley NeighborhoodEstimated Value: $1,366,000 - $2,415,000
3
Beds
2
Baths
2,689
Sq Ft
$763/Sq Ft
Est. Value
About This Home
This home is located at 2650 Hilgard Ave, Berkeley, CA 94709 and is currently estimated at $2,050,652, approximately $762 per square foot. 2650 Hilgard Ave is a home located in Alameda County with nearby schools including Berkeley Arts Magnet at Whittier School, Washington Elementary School, and Cragmont Elementary School.
Ownership History
Date
Name
Owned For
Owner Type
Purchase Details
Closed on
Aug 5, 2020
Sold by
Ehrlich John S
Bought by
Ehrlich John S and The John S Ehrlich Jr Trust
Current Estimated Value
Home Financials for this Owner
Home Financials are based on the most recent Mortgage that was taken out on this home.
Original Mortgage
$612,500
Outstanding Balance
$543,331
Interest Rate
3%
Mortgage Type
New Conventional
Estimated Equity
$1,507,321
Purchase Details
Closed on
Jan 29, 2019
Sold by
Ehrlich John S
Bought by
Ehrlich John S and John S Ehrlich Jr Trust
Purchase Details
Closed on
Jun 1, 2017
Sold by
Harvey Phillip R and Harvey Richard A
Bought by
Ehrlich John S
Home Financials for this Owner
Home Financials are based on the most recent Mortgage that was taken out on this home.
Original Mortgage
$636,000
Interest Rate
4.03%
Mortgage Type
New Conventional
Create a Home Valuation Report for This Property
The Home Valuation Report is an in-depth analysis detailing your home's value as well as a comparison with similar homes in the area
Home Values in the Area
Average Home Value in this Area
Purchase History
| Date | Buyer | Sale Price | Title Company |
|---|---|---|---|
| Ehrlich John S | -- | Accommodation | |
| Ehrlich John S | -- | Wfg Title Company Of Ca | |
| Ehrlich John S | -- | None Available | |
| Ehrlich John S | $1,865,000 | Chicago Title Company |
Source: Public Records
Mortgage History
| Date | Status | Borrower | Loan Amount |
|---|---|---|---|
| Open | Ehrlich John S | $612,500 | |
| Closed | Ehrlich John S | $636,000 |
Source: Public Records
Tax History
| Year | Tax Paid | Tax Assessment Tax Assessment Total Assessment is a certain percentage of the fair market value that is determined by local assessors to be the total taxable value of land and additions on the property. | Land | Improvement |
|---|---|---|---|---|
| 2025 | $15,366 | $823,654 | $231,959 | $598,695 |
| 2024 | $15,366 | $807,367 | $227,411 | $586,956 |
| 2023 | $14,959 | $798,403 | $222,953 | $575,450 |
| 2022 | $14,568 | $775,749 | $218,582 | $564,167 |
| 2021 | $14,568 | $760,402 | $214,296 | $553,106 |
| 2020 | $13,652 | $759,537 | $212,100 | $547,437 |
| 2019 | $12,616 | $744,647 | $207,942 | $536,705 |
| 2018 | $12,370 | $730,051 | $203,866 | $526,185 |
| 2017 | $7,548 | $353,980 | $276,870 | $77,110 |
| 2016 | $8,113 | $347,040 | $271,442 | $75,598 |
| 2015 | $7,963 | $341,829 | $267,366 | $74,463 |
| 2014 | $7,771 | $335,134 | $262,129 | $73,005 |
Source: Public Records
Map
Nearby Homes
- 2600 Hilgard Ave
- 2634 Virginia St Unit 13
- 2700 Le Conte Ave Unit 301
- 2700 Le Conte Ave Unit 402
- 2451 Le Conte Ave
- 1471 Scenic Ave
- 2340 Virginia St
- 2201 Virginia St Unit 2
- 0 Queens Rd Unit ML82024219
- 1375 Queens Rd
- 209 Fairlawn Dr
- 1444 Walnut St
- 1468 Summit Rd
- 1440 Walnut St Unit 5
- 1136 Keith Ave
- 1165 Cragmont Ave
- 120 Hill Rd
- 2012 Rose St
- 1110 Sterling Ave
- 1106 Cragmont Ave
- 2630 Hilgard Ave
- 2662 Hilgard Ave
- 2670 Hilgard Ave
- 2628 Hilgard Ave
- 2655 Virginia St
- 1665 Le Roy Ave
- 2678 Hilgard Ave
- 1675 Le Roy Ave
- 2661 Virginia St
- 1685 Le Roy Ave
- 2673 Hilgard Ave
- 2623 Virginia St
- 1643 Le Roy Ave
- 2694 Hilgard Ave
- 2621 Virginia St
- 1636 Le Roy Ave
- 1644 La Loma Ave
- 1637 Le Roy Ave Unit 2
- 1635 Le Roy Ave Unit 1
- 1695 Le Roy Ave
Your Personal Tour Guide
Ask me questions while you tour the home.