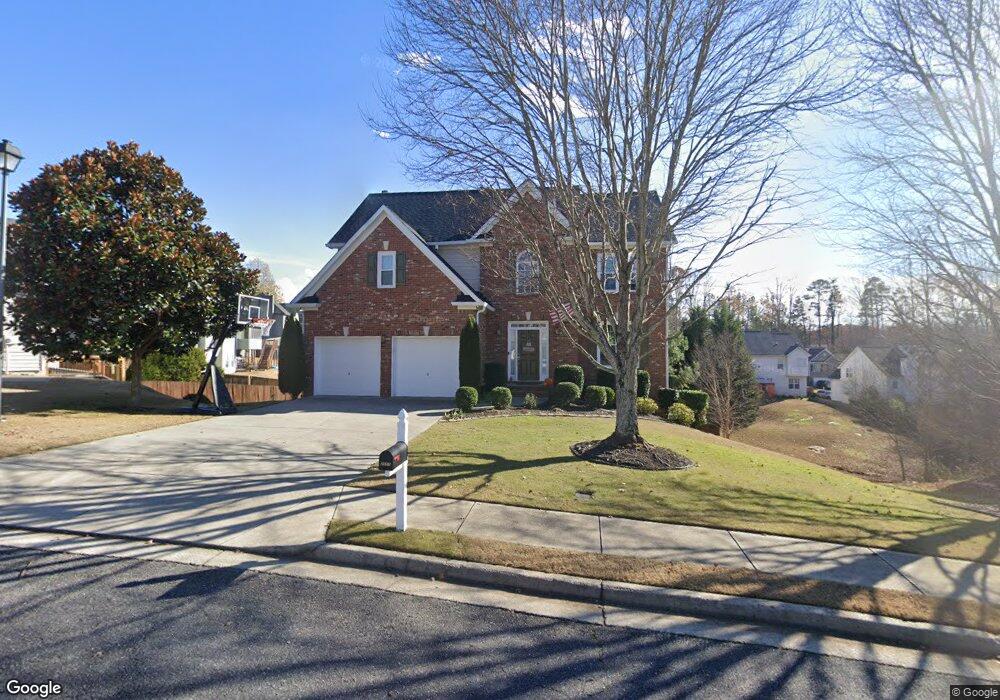
2651 Chandler Grove Ct Buford, GA 30519
Estimated Value: $467,000 - $484,014
4
Beds
3
Baths
2,461
Sq Ft
$192/Sq Ft
Est. Value
About This Home
This home is located at 2651 Chandler Grove Ct, Buford, GA 30519 and is currently estimated at $473,004, approximately $192 per square foot. 2651 Chandler Grove Ct is a home located in Gwinnett County with nearby schools including Patrick Elementary School and Glenn C. Jones Middle School.
Ownership History
Date
Name
Owned For
Owner Type
Purchase Details
Closed on
May 22, 2015
Sold by
Johnson Joshua Robert
Bought by
Johnson Joshua Robert and Johnson Jaclyn C
Current Estimated Value
Home Financials for this Owner
Home Financials are based on the most recent Mortgage that was taken out on this home.
Original Mortgage
$141,200
Outstanding Balance
$109,129
Interest Rate
3.77%
Mortgage Type
New Conventional
Estimated Equity
$363,875
Purchase Details
Closed on
Mar 30, 2011
Sold by
Federal Natl Mtg Assn Fnma
Bought by
Johnson Joshua R and Metz Jaclyn
Home Financials for this Owner
Home Financials are based on the most recent Mortgage that was taken out on this home.
Original Mortgage
$146,294
Interest Rate
4.75%
Mortgage Type
FHA
Purchase Details
Closed on
Aug 3, 2010
Sold by
Chase Hm Fin Llc
Bought by
Federal Natl Mtg Assn Fnma
Purchase Details
Closed on
Oct 31, 2002
Sold by
Touchstone Hms Ga Inc
Bought by
Turner David L
Home Financials for this Owner
Home Financials are based on the most recent Mortgage that was taken out on this home.
Original Mortgage
$185,250
Interest Rate
6.01%
Mortgage Type
New Conventional
Create a Home Valuation Report for This Property
The Home Valuation Report is an in-depth analysis detailing your home's value as well as a comparison with similar homes in the area
Home Values in the Area
Average Home Value in this Area
Purchase History
| Date | Buyer | Sale Price | Title Company |
|---|---|---|---|
| Johnson Joshua Robert | -- | -- | |
| Johnson Joshua R | -- | -- | |
| Federal Natl Mtg Assn Fnma | -- | -- | |
| Chase Hm Fin Llc | $172,831 | -- | |
| Turner David L | $195,000 | -- |
Source: Public Records
Mortgage History
| Date | Status | Borrower | Loan Amount |
|---|---|---|---|
| Open | Johnson Joshua Robert | $141,200 | |
| Previous Owner | Johnson Joshua R | $146,294 | |
| Previous Owner | Turner David L | $185,250 |
Source: Public Records
Tax History Compared to Growth
Tax History
| Year | Tax Paid | Tax Assessment Tax Assessment Total Assessment is a certain percentage of the fair market value that is determined by local assessors to be the total taxable value of land and additions on the property. | Land | Improvement |
|---|---|---|---|---|
| 2024 | $5,641 | $192,240 | $34,000 | $158,240 |
| 2023 | $5,641 | $192,240 | $34,000 | $158,240 |
| 2022 | $4,988 | $162,240 | $29,200 | $133,040 |
| 2021 | $4,188 | $120,600 | $22,800 | $97,800 |
| 2020 | $4,215 | $120,600 | $22,800 | $97,800 |
| 2019 | $4,080 | $120,600 | $22,800 | $97,800 |
| 2018 | $3,890 | $111,600 | $20,000 | $91,600 |
| 2016 | $3,431 | $88,760 | $18,000 | $70,760 |
| 2015 | $3,469 | $88,760 | $16,000 | $72,760 |
| 2014 | $2,463 | $60,040 | $16,800 | $43,240 |
Source: Public Records
Map
Nearby Homes
- 3665 Mystic Dr Unit 2
- 3685 Rolling Creek Dr
- 2753 Blue Moon Dr Unit 4
- 2692 Bogan Creek Dr
- 2330 Chandler Grove Dr
- 3775 Rolling Creek Dr
- 3765 Woodlawn Ct
- 4041 Lost Mill Ln
- 2551 Kilgore Rd
- 2710 Kilgore Rd
- 2550 Kilgore Rd
- 2380 Black Bear Ct
- 2361 Black Bear Ct Unit 2
- 2718 Kilgore Rd
- 2551 E Maddox Rd
- 3848 Heirloom Loop Ct
- 2859 Preserve Walk Ct NE
- 2859 Presertve at Hamilton Mill
- 2789 Kilgore Rd
- 2641 Chandler Grove Ct Unit 121
- 2641 Chandler Grove Ct
- 3620 Mystic Dr
- 2661 Chandler Grove Ct
- 2570 Chandler Grove Dr
- 3610 Mystic Dr
- 2560 Chandler Grove Dr
- 2580 Chandler Grove Dr Unit 2
- 2631 Chandler Grove Ct
- 2658 Chandler Grove Ct
- 2638 Chandler Grove Ct
- 2638 Chandler Grove Ct
- 2550 Chandler Grove Dr Unit 3
- 3630 Mystic Dr
- 0 Chandler Grove Dr Unit 8571269
- 0 Chandler Grove Dr Unit 8490914
- 0 Chandler Grove Dr Unit 8490127
- 0 Chandler Grove Dr Unit 8448881
- 0 Chandler Grove Dr Unit 8381201
- 0 Chandler Grove Dr Unit 8360355