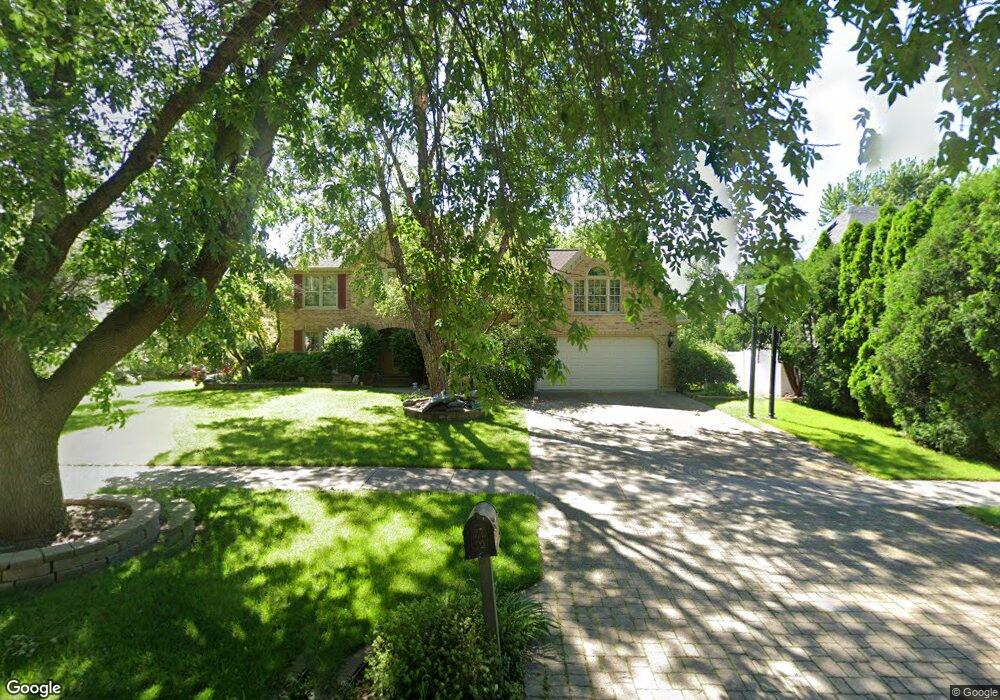
2651 Modaff Rd Naperville, IL 60565
Knoch Knolls NeighborhoodEstimated Value: $678,421 - $813,000
Studio
1
Bath
3,025
Sq Ft
$252/Sq Ft
Est. Value
About This Home
This home is located at 2651 Modaff Rd, Naperville, IL 60565 and is currently estimated at $762,105, approximately $251 per square foot. 2651 Modaff Rd is a home located in Will County with nearby schools including Spring Brook Elementary School, Gordon Gregory Middle School, and Neuqua Valley High School.
Ownership History
Date
Name
Owned For
Owner Type
Purchase Details
Closed on
Feb 9, 2002
Sold by
Frey Peter F and Frey Beverly D
Bought by
Lin Jing Taur and Jiang Manman
Current Estimated Value
Home Financials for this Owner
Home Financials are based on the most recent Mortgage that was taken out on this home.
Original Mortgage
$300,700
Interest Rate
6.87%
Purchase Details
Closed on
May 30, 1997
Sold by
Davis J Russ and Davis Nancy L
Bought by
Frey Peter F and Frey Beverly A
Home Financials for this Owner
Home Financials are based on the most recent Mortgage that was taken out on this home.
Original Mortgage
$185,000
Interest Rate
8.17%
Purchase Details
Closed on
Aug 11, 1994
Sold by
Williams Peter and Williams Sharon D
Bought by
Davis J Russ and Davis Nancy L
Home Financials for this Owner
Home Financials are based on the most recent Mortgage that was taken out on this home.
Original Mortgage
$250,200
Interest Rate
7.75%
Create a Home Valuation Report for This Property
The Home Valuation Report is an in-depth analysis detailing your home's value as well as a comparison with similar homes in the area
Home Values in the Area
Average Home Value in this Area
Purchase History
| Date | Buyer | Sale Price | Title Company |
|---|---|---|---|
| Lin Jing Taur | $390,500 | First American Title | |
| Frey Peter F | $286,000 | -- | |
| Davis J Russ | $278,000 | First American Title Insuran |
Source: Public Records
Mortgage History
| Date | Status | Borrower | Loan Amount |
|---|---|---|---|
| Previous Owner | Lin Jing Taur | $300,700 | |
| Previous Owner | Frey Peter F | $185,000 | |
| Previous Owner | Davis J Russ | $250,200 |
Source: Public Records
Tax History
| Year | Tax Paid | Tax Assessment Tax Assessment Total Assessment is a certain percentage of the fair market value that is determined by local assessors to be the total taxable value of land and additions on the property. | Land | Improvement |
|---|---|---|---|---|
| 2024 | $12,963 | $213,904 | $43,308 | $170,596 |
| 2023 | $12,963 | $188,961 | $38,258 | $150,703 |
| 2022 | $11,011 | $162,980 | $36,190 | $126,790 |
| 2021 | $10,505 | $155,219 | $34,467 | $120,752 |
| 2020 | $10,299 | $152,760 | $33,921 | $118,839 |
| 2019 | $10,111 | $148,455 | $32,965 | $115,490 |
| 2018 | $10,108 | $145,929 | $32,240 | $113,689 |
| 2017 | $9,942 | $142,162 | $31,408 | $110,754 |
| 2016 | $10,301 | $139,102 | $30,732 | $108,370 |
| 2015 | $10,123 | $133,752 | $29,550 | $104,202 |
| 2014 | $10,123 | $127,045 | $29,550 | $97,495 |
| 2013 | $10,123 | $127,045 | $29,550 | $97,495 |
Source: Public Records
Map
Nearby Homes
- 2734 Alyssa Dr
- 484 Blodgett Ct
- 2802 Wedgewood Dr
- 364 Avena Cir
- 352 Danbury Dr
- 2347 Wilmington Ct
- 203 Settlers Ct
- 2308 Modaff Rd
- 2305 Hartford Ct
- 2711 Wendy Dr
- 2715 Wendy Dr
- 719 Eagle Brook Ln Unit 4
- 51 Ford Ln
- 270 Pebblestone Rd
- 2438 Wendover Dr
- 599 Hempstead Ave
- 18 Newgate Ave
- 3339 Timber Creek Ln Unit 3
- 911 Rock Spring Rd
- 15 Pinnacle Ct
- 2701 Modaff Rd
- 2645 Modaff Rd
- 2688 Copperfield Dr
- 2692 Copperfield Dr
- 2696 Copperfield Dr
- 2705 Modaff Rd
- 404 Gateshead Dr Unit 1
- 408 Gateshead Dr
- 2700 Modaff Rd
- 2648 Modaff Rd Unit 1
- 2639 Modaff Rd
- 2704 Modaff Rd Unit 1
- 2700 Copperfield Dr Unit 1
- 2644 Modaff Rd
- 2709 Modaff Rd
- 405 Sierra Ct
- 2691 Copperfield Dr
- 2708 Modaff Rd
- 2704 Copperfield Dr
- 414 Gateshead Dr
Your Personal Tour Guide
Ask me questions while you tour the home.