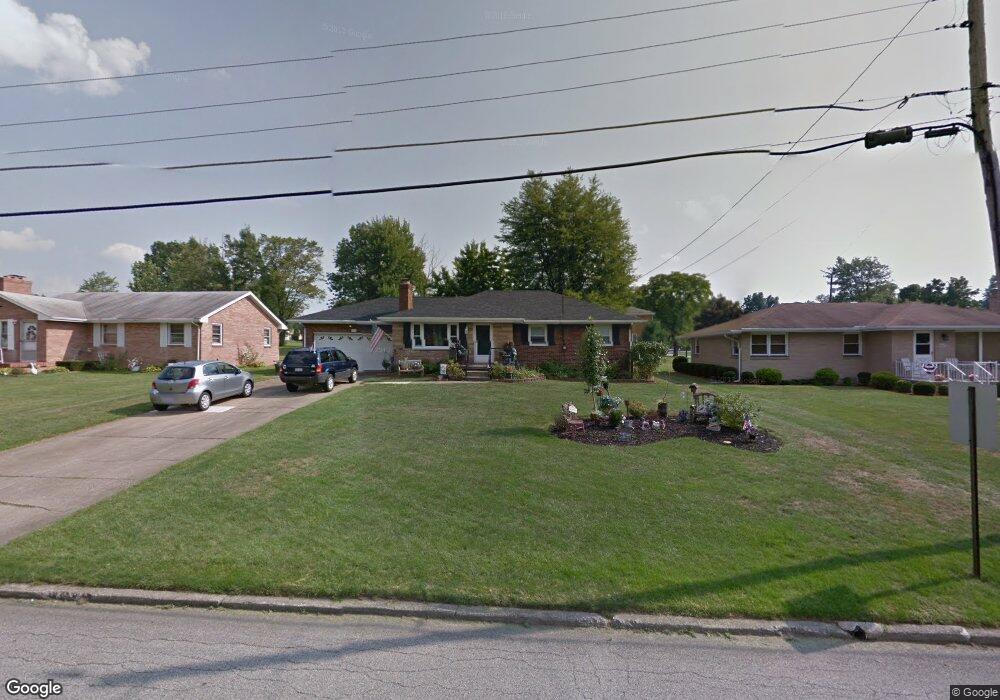
2651 Saginaw Dr Youngstown, OH 44514
Estimated Value: $224,668 - $262,000
3
Beds
2
Baths
1,464
Sq Ft
$163/Sq Ft
Est. Value
About This Home
This home is located at 2651 Saginaw Dr, Youngstown, OH 44514 and is currently estimated at $238,417, approximately $162 per square foot. 2651 Saginaw Dr is a home located in Mahoning County with nearby schools including Poland Union Elementary School, Poland Middle School, and Poland Seminary High School.
Ownership History
Date
Name
Owned For
Owner Type
Purchase Details
Closed on
May 23, 2008
Sold by
Sujka Zofia
Bought by
Macioge John D and Macioge Mary Ellen
Current Estimated Value
Home Financials for this Owner
Home Financials are based on the most recent Mortgage that was taken out on this home.
Original Mortgage
$63,000
Outstanding Balance
$40,002
Interest Rate
5.93%
Mortgage Type
New Conventional
Estimated Equity
$198,415
Purchase Details
Closed on
Aug 17, 2005
Sold by
Brew Kalliope A and Sdregas Katsadas Kalliope A
Bought by
Sujka Zofia
Purchase Details
Closed on
Feb 26, 2002
Sold by
Margetko Ann and Anderson Patricia Ann
Bought by
Sdregas Katsadas Kalliope A
Home Financials for this Owner
Home Financials are based on the most recent Mortgage that was taken out on this home.
Original Mortgage
$86,700
Interest Rate
6.92%
Purchase Details
Closed on
Apr 6, 2001
Bought by
John D Macioge
Purchase Details
Closed on
Nov 12, 1968
Bought by
Margetko Paul R and Margetko Ann
Create a Home Valuation Report for This Property
The Home Valuation Report is an in-depth analysis detailing your home's value as well as a comparison with similar homes in the area
Home Values in the Area
Average Home Value in this Area
Purchase History
| Date | Buyer | Sale Price | Title Company |
|---|---|---|---|
| Macioge John D | $132,500 | Attorney | |
| Sujka Zofia | $113,000 | -- | |
| Sdregas Katsadas Kalliope A | $102,000 | Reliable Title Agency Inc | |
| John D Macioge | -- | -- | |
| Margetko Paul R | -- | -- |
Source: Public Records
Mortgage History
| Date | Status | Borrower | Loan Amount |
|---|---|---|---|
| Open | Macioge John D | $63,000 | |
| Previous Owner | Sdregas Katsadas Kalliope A | $86,700 | |
| Closed | Sdregas Katsadas Kalliope A | $10,200 |
Source: Public Records
Tax History Compared to Growth
Tax History
| Year | Tax Paid | Tax Assessment Tax Assessment Total Assessment is a certain percentage of the fair market value that is determined by local assessors to be the total taxable value of land and additions on the property. | Land | Improvement |
|---|---|---|---|---|
| 2024 | $2,619 | $62,550 | $10,560 | $51,990 |
| 2023 | $2,589 | $62,550 | $10,560 | $51,990 |
| 2022 | $2,080 | $44,480 | $10,560 | $33,920 |
| 2021 | $1,986 | $44,480 | $10,560 | $33,920 |
| 2020 | $1,994 | $44,480 | $10,560 | $33,920 |
| 2019 | $1,734 | $37,060 | $10,560 | $26,500 |
| 2018 | $1,567 | $37,060 | $10,560 | $26,500 |
| 2017 | $1,564 | $37,060 | $10,560 | $26,500 |
| 2016 | $2,328 | $40,070 | $10,560 | $29,510 |
| 2015 | $2,278 | $40,070 | $10,560 | $29,510 |
| 2014 | $2,286 | $40,070 | $10,560 | $29,510 |
| 2013 | $2,257 | $40,070 | $10,560 | $29,510 |
Source: Public Records
Map
Nearby Homes
- 2667 Center Rd
- 2831 Center Rd
- 6074 Frontier Dr
- 2721 Algonquin Dr
- 2959 Holyoke Dr
- 2856 Heatherbrae Dr
- 20 Nesbitt St
- 2959 Algonquin Dr
- 2985 Algonquin Dr
- 3151 Heatherbrae Dr
- 6137 Acatello Place
- 2379 Clyde St
- 154 Rocky Ledge Dr
- 6666 Clingan Rd
- 0 Clingan Rd Unit 4461196
- 2829 Poland Village Blvd
- 6695 Clingan Rd Unit 24
- 6695 Clingan Rd Unit 32
- 6695 Clingan Rd Unit 10
- 6695 Clingan Rd Unit 4
- 2665 Saginaw Dr
- 2635 Saginaw Dr
- 2683 Saginaw Dr
- 2648 Saginaw Dr
- 2662 Saginaw Dr
- 2695 Saginaw Dr
- 2636 Saginaw Dr
- 2678 Saginaw Dr
- 6420 Diana Dr
- 6408 Diana Dr
- 6434 Diana Dr
- 6394 Diana Dr
- 2690 Saginaw Dr
- 2713 Saginaw Dr
- 6374 Diana Dr
- 6337 Diana Dr
- 6334 Apache Ln
- 6354 Diana Dr
- 6375 Apache Ln
- 2731 Saginaw Dr