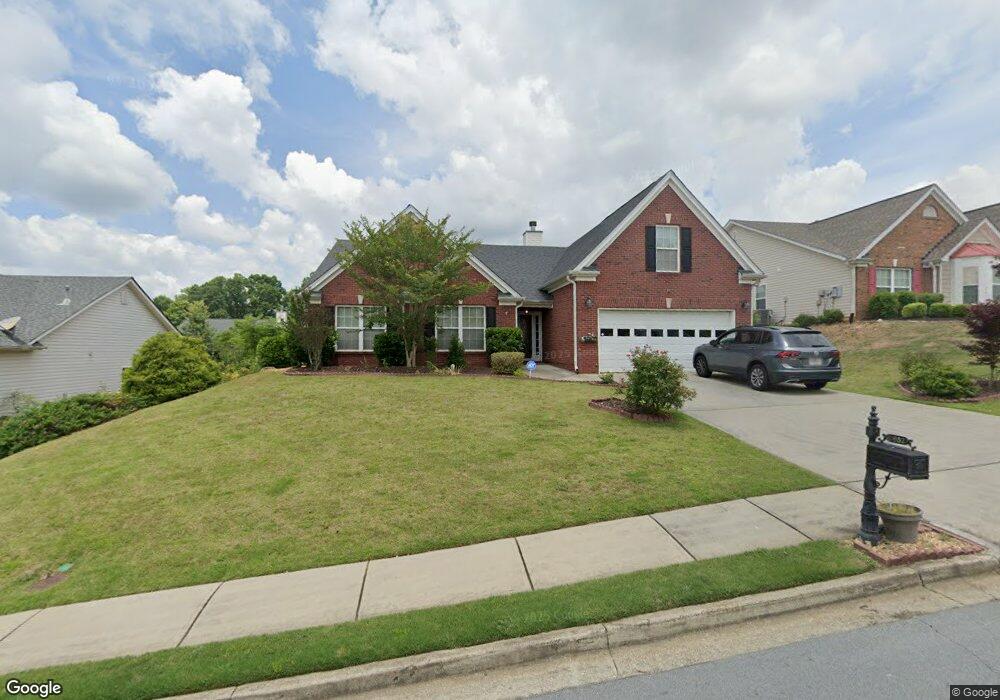
2652 Colleen Ln Unit 161 Dacula, GA 30019
Estimated Value: $408,000 - $422,000
3
Beds
2
Baths
2,540
Sq Ft
$164/Sq Ft
Est. Value
About This Home
This home is located at 2652 Colleen Ln Unit 161, Dacula, GA 30019 and is currently estimated at $417,160, approximately $164 per square foot. 2652 Colleen Ln Unit 161 is a home located in Gwinnett County with nearby schools including Dacula Elementary School, Dacula Middle School, and Dacula High School.
Ownership History
Date
Name
Owned For
Owner Type
Purchase Details
Closed on
Mar 28, 2022
Sold by
Zillow Homes Property Trust
Bought by
Hall Colette M and Hall Joseph
Current Estimated Value
Home Financials for this Owner
Home Financials are based on the most recent Mortgage that was taken out on this home.
Original Mortgage
$214,263
Outstanding Balance
$199,762
Interest Rate
3.89%
Mortgage Type
New Conventional
Estimated Equity
$217,398
Purchase Details
Closed on
Oct 5, 2021
Sold by
Mallwitz Thomas F
Bought by
Zillow Homes Property Trust
Purchase Details
Closed on
Jul 16, 2008
Sold by
Dahlman Frances E
Bought by
Mallwitz Thomas F and Mallwitz Kathleen L
Home Financials for this Owner
Home Financials are based on the most recent Mortgage that was taken out on this home.
Original Mortgage
$139,120
Interest Rate
6.61%
Mortgage Type
New Conventional
Purchase Details
Closed on
Jun 2, 2006
Sold by
Arlington Builders Llc
Bought by
Dahlman Frances E
Create a Home Valuation Report for This Property
The Home Valuation Report is an in-depth analysis detailing your home's value as well as a comparison with similar homes in the area
Home Values in the Area
Average Home Value in this Area
Purchase History
| Date | Buyer | Sale Price | Title Company |
|---|---|---|---|
| Hall Colette M | $375,900 | -- | |
| Zillow Homes Property Trust | $372,200 | -- | |
| Mallwitz Thomas F | $173,900 | -- | |
| Dahlman Frances E | $213,800 | -- |
Source: Public Records
Mortgage History
| Date | Status | Borrower | Loan Amount |
|---|---|---|---|
| Open | Hall Colette M | $214,263 | |
| Previous Owner | Mallwitz Thomas F | $139,120 |
Source: Public Records
Tax History Compared to Growth
Tax History
| Year | Tax Paid | Tax Assessment Tax Assessment Total Assessment is a certain percentage of the fair market value that is determined by local assessors to be the total taxable value of land and additions on the property. | Land | Improvement |
|---|---|---|---|---|
| 2025 | $6,696 | $179,480 | $30,000 | $149,480 |
| 2024 | $6,069 | $159,720 | $32,000 | $127,720 |
| 2023 | $6,069 | $150,000 | $26,000 | $124,000 |
| 2022 | $5,638 | $148,480 | $26,000 | $122,480 |
| 2021 | $1,444 | $110,440 | $20,800 | $89,640 |
| 2020 | $1,442 | $100,000 | $20,800 | $79,200 |
| 2019 | $1,266 | $82,000 | $16,800 | $65,200 |
| 2018 | $1,248 | $82,000 | $16,800 | $65,200 |
| 2016 | $1,176 | $73,840 | $14,000 | $59,840 |
| 2015 | $1,127 | $68,520 | $12,000 | $56,520 |
| 2014 | -- | $65,840 | $12,000 | $53,840 |
Source: Public Records
Map
Nearby Homes
- 67 Creek Side Place
- 2623 Carleton Gold Rd
- 2579 Wimberley Pine Ct
- 2652 Carleton Gold Rd
- 2800 Araglin Dr
- 2535 Fairmont Park Ct
- 2793 Austin Ridge Dr
- 2827 Riders Ct
- 2768 Ballyshannon Ct
- 2864 Auburn Ave
- 2693 Austin Ridge Dr
- 535 Maeve Ln
- 2896 Spence Ct
- 2015 Waycross Ln
- 2304 Pelham Pass
- 2407 Pelham Pass
- 1950 Van Allen Ct
- 1278 Hollingsworth Way
- 1940 Van Allen Ct
- 1949 Van Allen Ct
- 2652 Colleen Ln
- 2662 Colleen Ln
- 2583 Carleton Gold Rd
- 2573 Carleton Gold Rd
- 2672 Colleen Ln
- 2593 Carleton Gold Rd
- 2632 Colleen Ln
- 2651 Colleen Ln
- 2641 Colleen Ln
- 2661 Colleen Ln
- 2631 Colleen Ln
- 2603 Carleton Gold Rd Unit 6A
- 2631 Colleen Ln NE
- 2682 Colleen Ln Unit 6B
- 2671 Colleen Ln
- 2622 Colleen Ln
- 2553 Carleton Gold Rd
- 2621 Colleen Ln
- 2613 Carleton Gold Rd