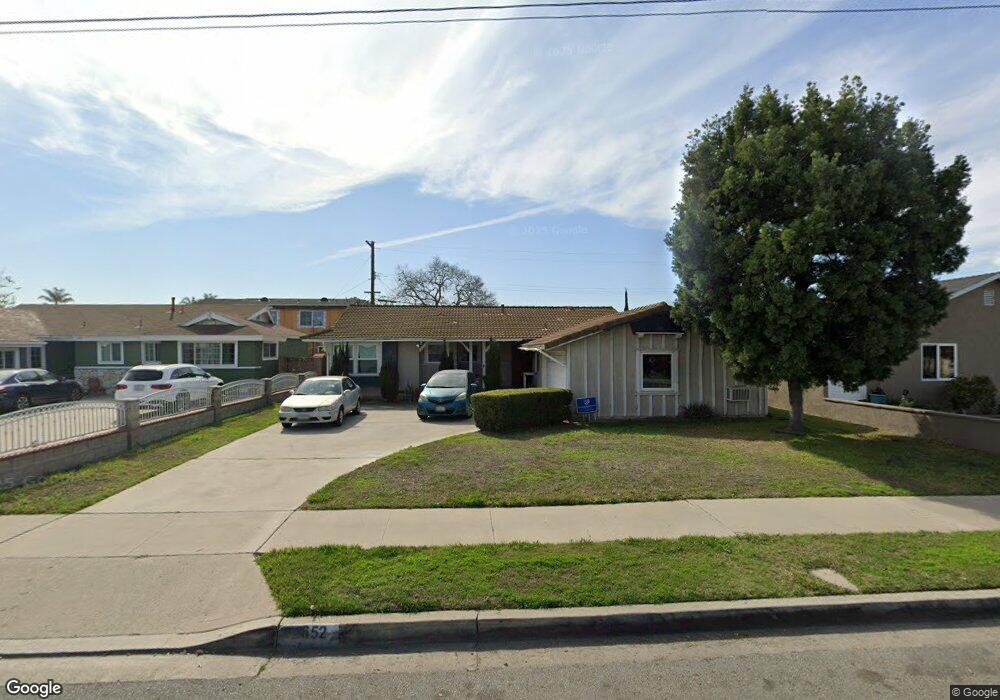
2652 W Crescent Ave Anaheim, CA 92801
Northwest Anaheim NeighborhoodEstimated Value: $722,000 - $834,000
3
Beds
2
Baths
1,060
Sq Ft
$731/Sq Ft
Est. Value
About This Home
This home is located at 2652 W Crescent Ave, Anaheim, CA 92801 and is currently estimated at $775,175, approximately $731 per square foot. 2652 W Crescent Ave is a home located in Orange County with nearby schools including Dr. Peter Marshall Elementary School, Dale Jr High School, and Savanna High School.
Ownership History
Date
Name
Owned For
Owner Type
Purchase Details
Closed on
Feb 5, 2018
Sold by
Ward Philip M and Ward Silvia S
Bought by
Ward Silvia S and Ward Philip M
Current Estimated Value
Home Financials for this Owner
Home Financials are based on the most recent Mortgage that was taken out on this home.
Original Mortgage
$136,500
Interest Rate
3.99%
Mortgage Type
New Conventional
Purchase Details
Closed on
Oct 3, 2008
Sold by
Ward Silvia S and Ward Philip M
Bought by
Ward Silvia S and Ward Philip M
Home Financials for this Owner
Home Financials are based on the most recent Mortgage that was taken out on this home.
Original Mortgage
$150,000
Interest Rate
6.39%
Mortgage Type
New Conventional
Purchase Details
Closed on
May 8, 2008
Sold by
Ward Silvia and Ward Philip
Bought by
Ward Silvia S and Ward Philip M
Purchase Details
Closed on
Nov 4, 2004
Sold by
Ward Silvia and Boggs Silvia Susan
Bought by
Ward Philip and Ward Silvia
Purchase Details
Closed on
Aug 18, 1998
Sold by
Noemi Boggs
Bought by
Boggs Noemi and Boggs Silvia Susan
Create a Home Valuation Report for This Property
The Home Valuation Report is an in-depth analysis detailing your home's value as well as a comparison with similar homes in the area
Home Values in the Area
Average Home Value in this Area
Purchase History
| Date | Buyer | Sale Price | Title Company |
|---|---|---|---|
| Ward Silvia S | -- | Lawyers Title | |
| Ward Philip M | -- | Lawyers Title | |
| Ward Silvia S | -- | Accommodation | |
| Ward Silvia S | -- | First American Title Company | |
| Ward Silvia S | -- | None Available | |
| Ward Philip | -- | Ticor Title Co Of California | |
| Boggs Noemi | -- | -- |
Source: Public Records
Mortgage History
| Date | Status | Borrower | Loan Amount |
|---|---|---|---|
| Closed | Ward Philip M | $136,500 | |
| Closed | Ward Silvia S | $150,000 |
Source: Public Records
Tax History Compared to Growth
Tax History
| Year | Tax Paid | Tax Assessment Tax Assessment Total Assessment is a certain percentage of the fair market value that is determined by local assessors to be the total taxable value of land and additions on the property. | Land | Improvement |
|---|---|---|---|---|
| 2025 | $1,282 | $84,090 | $27,531 | $56,559 |
| 2024 | $1,282 | $82,442 | $26,992 | $55,450 |
| 2023 | $1,246 | $80,826 | $26,463 | $54,363 |
| 2022 | $1,228 | $79,242 | $25,944 | $53,298 |
| 2021 | $1,213 | $77,689 | $25,436 | $52,253 |
| 2020 | $1,205 | $76,893 | $25,175 | $51,718 |
| 2019 | $1,182 | $75,386 | $24,682 | $50,704 |
| 2018 | $1,168 | $73,908 | $24,198 | $49,710 |
| 2017 | $1,133 | $72,459 | $23,723 | $48,736 |
| 2016 | $1,126 | $71,039 | $23,258 | $47,781 |
| 2015 | $1,114 | $69,972 | $22,908 | $47,064 |
| 2014 | $1,067 | $68,602 | $22,459 | $46,143 |
Source: Public Records
Map
Nearby Homes
- 605 N La Reina St
- 2625 W Cameron Ct Unit 121
- 2709 W Madison Cir
- 400 N Syracuse St
- 8319 Hickory Dr
- 199 N Magnolia Ave Unit B
- 2544 W Greenacre Ave
- 8054 Teakwood Cir
- 525 N Gilbert St Unit 106
- 525 N Gilbert St Unit 151
- 1006 N Hampton Place
- 2770 W Lincoln Ave Unit 29A
- 2770 W Lincoln Ave Unit 40
- 2770 W Lincoln Ave Unit 58
- 2955 W Lincoln Ave Unit 7
- 134 S Magnolia Ave Unit 4C
- 2871 W Tyler Ave
- 728 N Geneva St
- 1028 N Mayflower St
- 2943 W Lincoln Ave
- 2656 W Crescent Ave
- 2648 W Crescent Ave
- 2653 W Stockton Ave
- 2657 W Stockton Ave
- 2649 W Stockton Ave
- 2660 W Crescent Ave
- 2696 W Cameron Ct
- 2678 W Cameron Ct
- 2661 W Stockton Ave
- 2653 W Crescent Ave
- 2676 W Cameron Ct Unit 105
- 2694 W Cameron Ct Unit 2
- 2657 W Crescent Ave
- 2647 W Crescent Ave
- 2666 W Cameron Ct Unit 106
- 2664 W Crescent Ave
- 2692 W Cameron Ct
- 2661 W Crescent Ave
- 2664 W Cameron Ct Unit 107
- 2665 W Stockton Ave