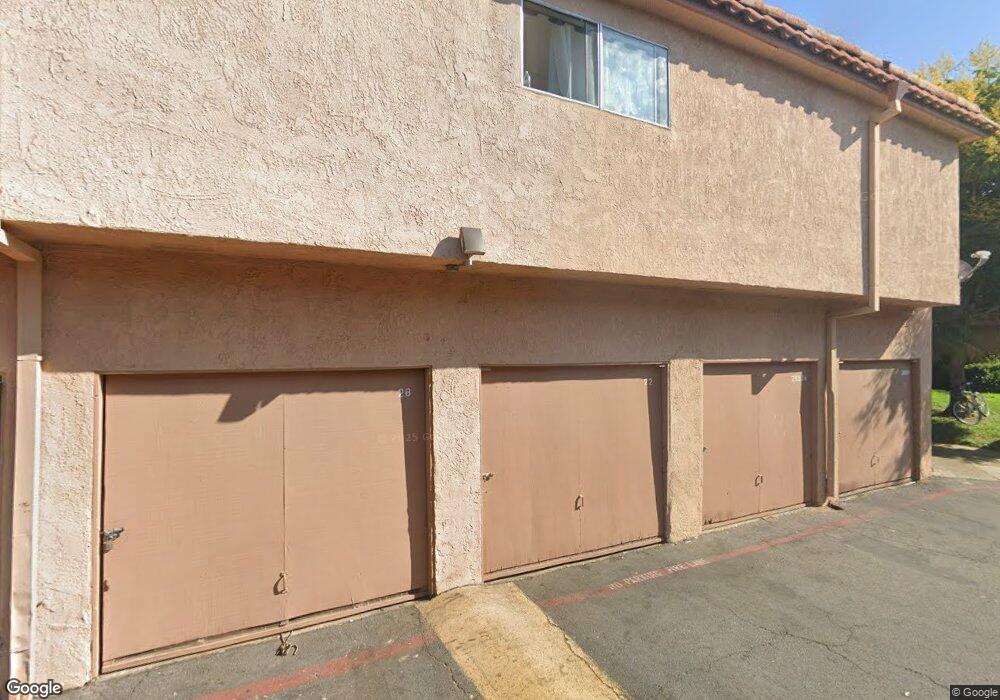
26524 Paseo Santa Clara Unit 126 San Juan Capistrano, CA 92675
Estimated Value: $542,000 - $715,000
3
Beds
1
Bath
1,037
Sq Ft
$576/Sq Ft
Est. Value
About This Home
This home is located at 26524 Paseo Santa Clara Unit 126, San Juan Capistrano, CA 92675 and is currently estimated at $597,566, approximately $576 per square foot. 26524 Paseo Santa Clara Unit 126 is a home located in Orange County with nearby schools including Kinoshita Elementary School, Marco Forster Middle School, and San Juan Hills High School.
Ownership History
Date
Name
Owned For
Owner Type
Purchase Details
Closed on
Sep 12, 2017
Sold by
Demeire Cindy and Demeire Kevin
Bought by
Demeire Kevin Michael and Demeire Cindy Chantevi
Current Estimated Value
Purchase Details
Closed on
Jul 11, 2011
Sold by
Velasco Eduardo
Bought by
Demeire Cindy and Demeire Kevin
Purchase Details
Closed on
Mar 22, 2004
Sold by
Casillas Mirozlava
Bought by
Velasco Eduardo
Home Financials for this Owner
Home Financials are based on the most recent Mortgage that was taken out on this home.
Original Mortgage
$208,000
Interest Rate
6.4%
Mortgage Type
New Conventional
Purchase Details
Closed on
Jan 24, 2002
Sold by
Osorio Mauricio and Osorio Jovita
Bought by
Velasco Eduardo
Create a Home Valuation Report for This Property
The Home Valuation Report is an in-depth analysis detailing your home's value as well as a comparison with similar homes in the area
Home Values in the Area
Average Home Value in this Area
Purchase History
| Date | Buyer | Sale Price | Title Company |
|---|---|---|---|
| Demeire Kevin Michael | -- | None Available | |
| Demeire Cindy | $143,200 | None Available | |
| Velasco Eduardo | -- | Fidelity National Title Co | |
| Velasco Eduardo | -- | -- |
Source: Public Records
Mortgage History
| Date | Status | Borrower | Loan Amount |
|---|---|---|---|
| Previous Owner | Velasco Eduardo | $208,000 |
Source: Public Records
Tax History Compared to Growth
Tax History
| Year | Tax Paid | Tax Assessment Tax Assessment Total Assessment is a certain percentage of the fair market value that is determined by local assessors to be the total taxable value of land and additions on the property. | Land | Improvement |
|---|---|---|---|---|
| 2025 | $2,169 | $213,524 | $146,573 | $66,951 |
| 2024 | $2,169 | $209,338 | $143,699 | $65,639 |
| 2023 | $2,125 | $205,234 | $140,882 | $64,352 |
| 2022 | $2,087 | $201,210 | $138,119 | $63,091 |
| 2021 | $2,049 | $197,265 | $135,411 | $61,854 |
| 2020 | $2,031 | $195,243 | $134,023 | $61,220 |
| 2019 | $1,994 | $191,415 | $131,395 | $60,020 |
| 2018 | $1,958 | $187,662 | $128,818 | $58,844 |
| 2017 | $1,940 | $183,983 | $126,292 | $57,691 |
| 2016 | $1,905 | $180,376 | $123,816 | $56,560 |
| 2015 | $1,875 | $177,667 | $121,956 | $55,711 |
| 2014 | $1,842 | $174,187 | $119,567 | $54,620 |
Source: Public Records
Map
Nearby Homes
- 31377 Los Rios St Unit 64
- 31284 Calle San Juan Unit 14
- 31278 Calle San Juan Unit 12
- 31261 Paseo Olivos
- 31595 Los Rios St Unit 78
- 31608 Los Rios St Unit 147
- 26468 Calle San Antonio
- 0 Aguacate Rd Unit 25558127
- 31121 Via Santo Tomas
- 31462 La Matanza St
- 26447 Paseo Carmel Unit 11D
- 31527 Aguacate Rd
- 31024 Calle San Diego Unit 94b
- 30828 Calle Chueca
- 27381 Via Priorato
- 30981 Via Mirador
- 32011 Via Tonada Unit 9
- 31872 Paseo Cielo
- 32165 Paseo Carolina Unit 207
- 31892 Paseo Cielo
- 26528 Paseo Santa Clara
- 26526 Paseo Santa Clara Unit 127C
- 26522 Paseo Santa Clara Unit 125
- 26532 Paseo Santa Clara
- 26516 Paseo Santa Clara Unit 131C
- 26557 Calle Santa Barbara Unit 50
- 26518 Paseo Santa Clara
- 26512 Paseo Santa Clara Unit 129e
- 26512 Paseo Santa Clara
- 26534 Paseo Santa Clara Unit 122b
- 26534 Paseo Santa Clara
- 26547 Calle Santa Barbara Unit 46
- 26547 Calle Santa Barbara
- 26542 Paseo Santa Clara Unit 117E
- 26536 Paseo Santa Clara Unit 123C
- 26553 Calle Santa Barbara Unit 48
- 26553 Calle Santa Barbara
- 26514 Paseo Santa Clara Unit 130B
- 26555 Calle Santa Barbara Unit 49
- 26561 Calle Santa Barbara