2654 Menvielle St Imperial, CA 92251
Estimated Value: $380,000 - $417,000
Studio
--
Bath
1,166
Sq Ft
$339/Sq Ft
Est. Value
About This Home
This home is located at 2654 Menvielle St, Imperial, CA 92251 and is currently estimated at $395,151, approximately $338 per square foot. 2654 Menvielle St is a home with nearby schools including Ben Hulse Elementary School, Frank M. Wright Middle School, and Imperial High School.
Ownership History
Date
Name
Owned For
Owner Type
Purchase Details
Closed on
May 4, 2021
Sold by
Luevano Jesus
Bought by
Luevano Jesus and Luevano Eloisa
Current Estimated Value
Home Financials for this Owner
Home Financials are based on the most recent Mortgage that was taken out on this home.
Original Mortgage
$208,000
Outstanding Balance
$188,500
Interest Rate
3.1%
Mortgage Type
New Conventional
Estimated Equity
$206,651
Purchase Details
Closed on
Apr 16, 2014
Sold by
Luevano Eloisa
Bought by
Luevano Jesus
Home Financials for this Owner
Home Financials are based on the most recent Mortgage that was taken out on this home.
Original Mortgage
$175,510
Interest Rate
4.38%
Mortgage Type
New Conventional
Purchase Details
Closed on
Mar 26, 2014
Sold by
Menvielle Joseph J and Menvielle Cynthia L
Bought by
Luevano Jesus
Home Financials for this Owner
Home Financials are based on the most recent Mortgage that was taken out on this home.
Original Mortgage
$175,510
Interest Rate
4.38%
Mortgage Type
New Conventional
Create a Home Valuation Report for This Property
The Home Valuation Report is an in-depth analysis detailing your home's value as well as a comparison with similar homes in the area
Purchase History
| Date | Buyer | Sale Price | Title Company |
|---|---|---|---|
| Luevano Jesus | -- | Chicago Title Company | |
| Luevano Jesus | -- | Stewart Title | |
| Luevano Jesus | $172,000 | Chicago Title Company |
Source: Public Records
Mortgage History
| Date | Status | Borrower | Loan Amount |
|---|---|---|---|
| Open | Luevano Jesus | $208,000 | |
| Previous Owner | Luevano Jesus | $175,510 |
Source: Public Records
Tax History
| Year | Tax Paid | Tax Assessment Tax Assessment Total Assessment is a certain percentage of the fair market value that is determined by local assessors to be the total taxable value of land and additions on the property. | Land | Improvement |
|---|---|---|---|---|
| 2025 | $2,301 | $210,837 | $36,771 | $174,066 |
| 2023 | $2,301 | $202,651 | $35,344 | $167,307 |
| 2022 | $2,252 | $198,678 | $34,651 | $164,027 |
| 2021 | $2,218 | $194,783 | $33,972 | $160,811 |
| 2020 | $2,195 | $192,787 | $33,624 | $159,163 |
| 2019 | $2,165 | $189,008 | $32,965 | $156,043 |
| 2018 | $2,137 | $185,303 | $32,319 | $152,984 |
| 2017 | $2,013 | $181,671 | $31,686 | $149,985 |
| 2016 | $1,940 | $178,110 | $31,065 | $147,045 |
| 2015 | $1,961 | $175,436 | $30,599 | $144,837 |
| 2014 | $33 | $2,398 | $2,398 | $0 |
Source: Public Records
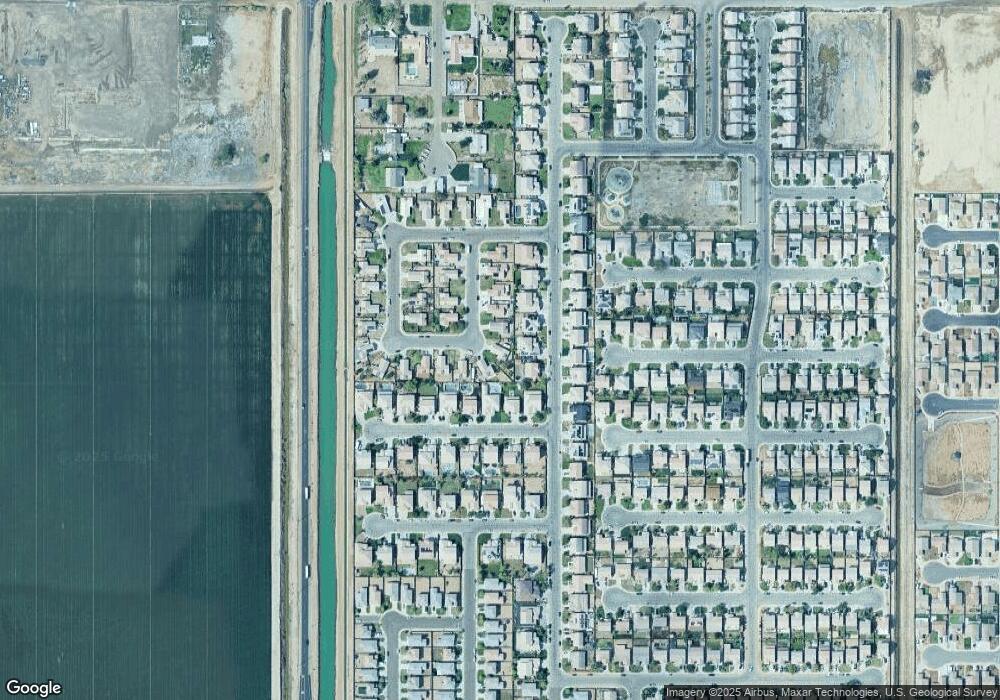
Map
Nearby Homes
- 687 Pyrite St
- 2656 Menvielle St
- 2655 Oasis St
- 2653 Oasis St
- 2657 Oasis St
- 689 Pyrite St
- 2658 Menvielle St
- 684 Granite St
- 686 Granite St
- 688 Granite St
- 682 Granite St
- 2659 Oasis St
- 691 Pyrite St
- 2657 Menvielle St
- 2660 Menvielle St
- 690 Granite St
- 2654 Oasis St
- 2659 Menvielle St
- 2656 0 Oasis St
- 2656 Oasis St
Your Personal Tour Guide
Ask me questions while you tour the home.