
Seller's Agent in 2025
Shishana Hogg
Mogul Real Estate
(509) 714-2162
1 in this area
320 Total Sales
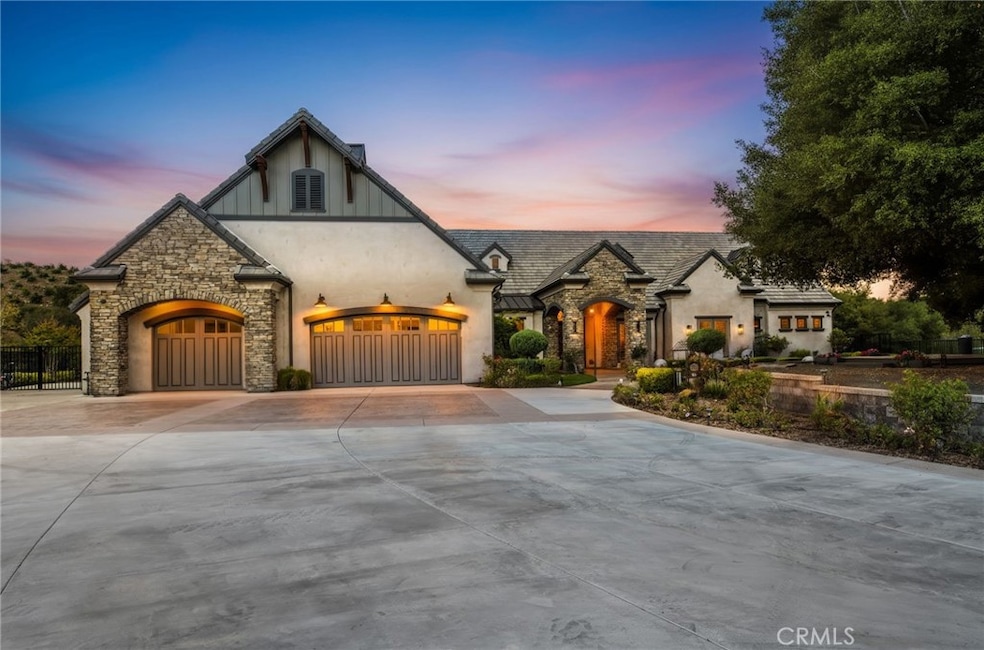
Exquisite single-story estate nestled in Temecula’s prestigious De Luz community—a rare blend of sophistication, functionality, and serene country luxury just minutes from town. Nearly 4 acres of usable land, this 4,280 sq ft custom home is framed by 360-degree panoramic views offering total privacy and timeless elegance from every angle. From the moment you arrive through the private gated entrance and long scenic driveway, the property commands attention with modern architecture, lush landscaping, and grand covered entry accented by custom double doors. Inside, the home opens to a soaring foyer and expansive great room highlighted by exposed wood-beam ceilings, cantina-style doors, and California room with multi-panel sliding doors and grand stone fireplace—perfectly designed for seamless indoor-outdoor entertaining. The chef’s kitchen is a true masterpiece, featuring an oversized island with seating for up to 10 comfortably, top-of-the-line appliances, walk-in pantry, and additional prep kitchen—ideal for hosting at scale. Flowing effortlessly into the family room and outdoor spaces, every detail was thoughtfully curated for comfort and connection. The primary suite is a luxurious retreat- offering direct patio access, two walk-in closets with custom cabinetry, and spa-inspired bathroom featuring oversized walk-in shower with dual shower heads and soaking tub positioned beneath an artisan stained-glass window. 4 additional bedrooms are generously sized, including a guest suite with a private entrance and patio, and another with its own wet bar—easily converted into a kitchenette. Spacious executive office with double-door access and views of the mature oak tree completes the thoughtful layout. Outdoors, the estate was custom-built for entertaining and relaxation. Enjoy expansive stamped-concrete patios, outdoor kitchen, splash pad, and oversized swim spa—all surrounded by lush landscaping and breathtaking views. The property also features a newly constructed (2025) 48’×24’ barn-14’ sliding door, picture window, and passenger door - with lower-gate private access—perfect for storage, hobbies, or future customization. Additional highlights include a 3-car garage with epoxy floors, built-in cabinetry, pull-down storage, and utility sink, a large designer laundry room, and a custom walking labyrinth surrounded by fruit trees and scenic garden paths. Every element of this estate was intentionally crafted for the ultimate Temecula, De Luz lifestyle.
Last Agent to Sell the Property
Mogul Real Estate Brokerage Phone: 509-714-2162 License #02018453 Listed on: 10/15/2025
Last Buyer's Agent
Mogul Real Estate Brokerage Phone: 509-714-2162 License #02018453 Listed on: 10/15/2025
| Date | Type | Sale Price | Title Company |
|---|---|---|---|
| Grant Deed | $2,540,000 | Ticor Title Company | |
| Grant Deed | -- | None Listed On Document | |
| Grant Deed | -- | None Listed On Document | |
| Grant Deed | $345,000 | Lawyers Title Insurance Comp | |
| Grant Deed | $515,000 | Southland Title Corporation |
| Date | Status | Loan Amount | Loan Type |
|---|---|---|---|
| Open | $1,560,000 | New Conventional | |
| Previous Owner | $105,000 | Purchase Money Mortgage |
| Date | Event | Price | List to Sale | Price per Sq Ft |
|---|---|---|---|---|
| 12/08/2025 12/08/25 | Sold | $2,540,000 | -7.6% | $593 / Sq Ft |
| 10/24/2025 10/24/25 | Pending | -- | -- | -- |
| 10/15/2025 10/15/25 | For Sale | $2,750,000 | -- | $643 / Sq Ft |
| Year | Tax Paid | Tax Assessment Tax Assessment Total Assessment is a certain percentage of the fair market value that is determined by local assessors to be the total taxable value of land and additions on the property. | Land | Improvement |
|---|---|---|---|---|
| 2025 | $16,131 | $1,249,389 | $384,852 | $864,537 |
| 2023 | $16,131 | $1,200,875 | $369,908 | $830,967 |
| 2022 | $16,009 | $1,177,329 | $362,655 | $814,674 |
| 2021 | $15,711 | $1,154,245 | $355,545 | $798,700 |
| 2020 | $8,802 | $547,801 | $351,900 | $195,901 |
| 2019 | $6,463 | $345,000 | $345,000 | $0 |
| 2018 | $3,352 | $155,000 | $154,547 | $453 |
| 2017 | $10,581 | $594,497 | $594,052 | $445 |
| 2016 | $2,878 | $125,000 | $124,561 | $439 |
| 2015 | $2,884 | $125,006 | $124,574 | $432 |
| 2014 | $2,842 | $125,000 | $124,574 | $426 |
Seller's Agent in 2025
Shishana Hogg
Mogul Real Estate
(509) 714-2162
1 in this area
320 Total Sales
Source: California Regional Multiple Listing Service (CRMLS)
MLS Number: SW25238440
APN: 936-200-012
Disclaimer: Certain information contained herein is derived from information provided by parties other than Homes.com. All information provided is deemed reliable, but is not guaranteed to be accurate and should be independently verified.
![]() The multiple listing data appearing on this website, or contained in reports produced therefrom, is owned and copyrighted by California Regional Multiple Listing Service, Inc. ("CRMLS") and is protected by all applicable copyright laws. Information provided is for viewer's personal, non-commercial use and may not be used for any purpose other than to identify prospective properties the viewer may be interested in purchasing. All listing data, including but not limited to square footage and lot size is believed to be accurate, but the listing Agent, listing Broker and CRMLS and its affiliates do not warrant or guarantee such accuracy. The viewer should independently verify the listed data prior to making any decisions based on such information by personal inspection and/or contacting a real estate professional.
The multiple listing data appearing on this website, or contained in reports produced therefrom, is owned and copyrighted by California Regional Multiple Listing Service, Inc. ("CRMLS") and is protected by all applicable copyright laws. Information provided is for viewer's personal, non-commercial use and may not be used for any purpose other than to identify prospective properties the viewer may be interested in purchasing. All listing data, including but not limited to square footage and lot size is believed to be accurate, but the listing Agent, listing Broker and CRMLS and its affiliates do not warrant or guarantee such accuracy. The viewer should independently verify the listed data prior to making any decisions based on such information by personal inspection and/or contacting a real estate professional.
Based on information from California Regional Multiple Listing Service, Inc. and /or other sources. All data, including all measurements and calculations of area, is obtained from various sources and has not been, and will not be, verified by broker or MLS. All information should be independently reviewed and verified for accuracy. Properties may or may not be listed by the office/agent presenting the information
Ask me questions while you tour the home.