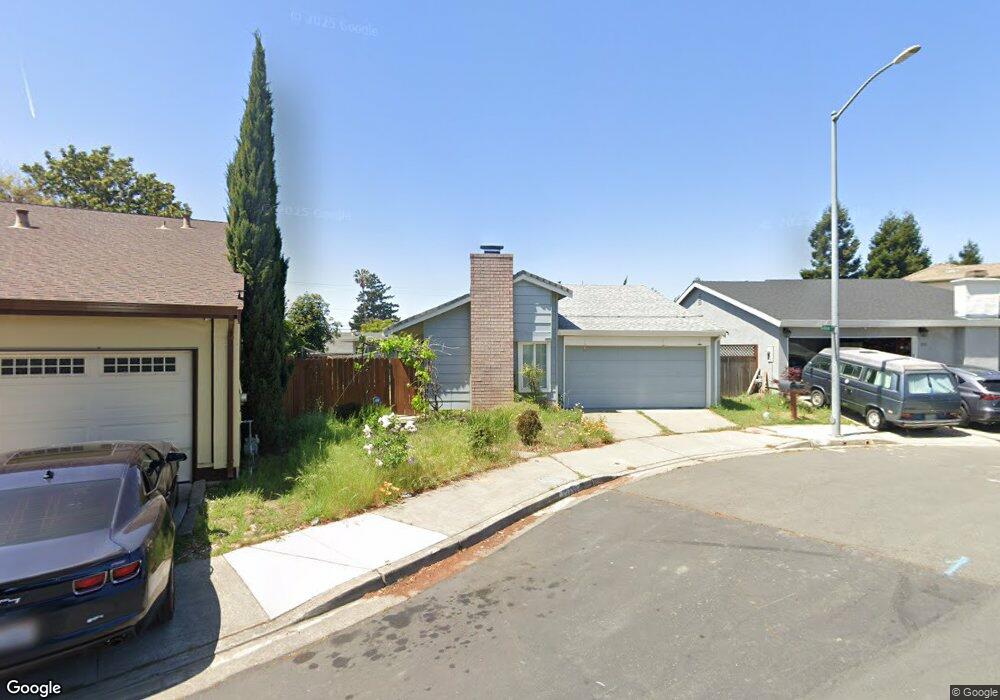
26549 Joshua St Hayward, CA 94544
Whitman-Wocine NeighborhoodEstimated Value: $833,000 - $887,000
3
Beds
2
Baths
1,119
Sq Ft
$767/Sq Ft
Est. Value
About This Home
This home is located at 26549 Joshua St, Hayward, CA 94544 and is currently estimated at $858,614, approximately $767 per square foot. 26549 Joshua St is a home located in Alameda County with nearby schools including Tyrrell Elementary School, Cesar Chavez Middle School, and Tennyson High School.
Ownership History
Date
Name
Owned For
Owner Type
Purchase Details
Closed on
Jan 31, 2018
Sold by
Dunne Kosan I
Bought by
Coletto William J
Current Estimated Value
Home Financials for this Owner
Home Financials are based on the most recent Mortgage that was taken out on this home.
Original Mortgage
$380,000
Outstanding Balance
$321,826
Interest Rate
3.99%
Mortgage Type
New Conventional
Estimated Equity
$536,788
Purchase Details
Closed on
Feb 7, 2003
Sold by
Viray Relly C and Viray Ann S
Bought by
Dunne Kosan I
Home Financials for this Owner
Home Financials are based on the most recent Mortgage that was taken out on this home.
Original Mortgage
$190,000
Interest Rate
5.89%
Purchase Details
Closed on
Apr 14, 1997
Sold by
Cant Andrew M and Cant Elaine N
Bought by
Viray Relly C and Viray Ann S
Home Financials for this Owner
Home Financials are based on the most recent Mortgage that was taken out on this home.
Original Mortgage
$161,679
Interest Rate
7.86%
Mortgage Type
FHA
Purchase Details
Closed on
Sep 22, 1993
Sold by
Dwyer Thomas M and Dwyer Gerda M
Bought by
Cant Andrew M and Cant Elaine N
Home Financials for this Owner
Home Financials are based on the most recent Mortgage that was taken out on this home.
Original Mortgage
$153,772
Interest Rate
8.6%
Create a Home Valuation Report for This Property
The Home Valuation Report is an in-depth analysis detailing your home's value as well as a comparison with similar homes in the area
Home Values in the Area
Average Home Value in this Area
Purchase History
| Date | Buyer | Sale Price | Title Company |
|---|---|---|---|
| Coletto William J | $640,000 | Fidelity National Title Comp | |
| Dunne Kosan I | $390,000 | Alliance Title Company | |
| Viray Relly C | $164,500 | American Title Co | |
| Cant Andrew M | $159,090 | Chicago Title Company |
Source: Public Records
Mortgage History
| Date | Status | Borrower | Loan Amount |
|---|---|---|---|
| Open | Coletto William J | $380,000 | |
| Previous Owner | Dunne Kosan I | $190,000 | |
| Previous Owner | Viray Relly C | $161,679 | |
| Previous Owner | Cant Andrew M | $153,772 |
Source: Public Records
Tax History Compared to Growth
Tax History
| Year | Tax Paid | Tax Assessment Tax Assessment Total Assessment is a certain percentage of the fair market value that is determined by local assessors to be the total taxable value of land and additions on the property. | Land | Improvement |
|---|---|---|---|---|
| 2025 | $8,749 | $721,197 | $218,459 | $509,738 |
| 2024 | $8,749 | $706,920 | $214,176 | $499,744 |
| 2023 | $8,617 | $699,922 | $209,976 | $489,946 |
| 2022 | $8,448 | $679,201 | $205,860 | $480,341 |
| 2021 | $8,378 | $665,748 | $201,824 | $470,924 |
| 2020 | $8,284 | $665,855 | $199,756 | $466,099 |
| 2019 | $8,438 | $652,800 | $195,840 | $456,960 |
| 2018 | $6,137 | $496,398 | $148,919 | $347,479 |
| 2017 | $5,906 | $486,668 | $146,000 | $340,668 |
| 2016 | $5,594 | $477,128 | $143,138 | $333,990 |
| 2015 | $5,086 | $435,000 | $130,500 | $304,500 |
| 2014 | $4,434 | $385,000 | $115,500 | $269,500 |
Source: Public Records
Map
Nearby Homes
- 250 Jacaranda Dr
- 266 Gloria St
- 26132 Jane Ave
- 26632 Luvena Dr
- 26361 Huntwood Ave
- 250 Schafer Rd
- 26583 Greta Ln
- 399 Schafer Rd
- 25943 Dollar St
- 26517 Sunvale Ct Unit 3
- 25696 Lander Ave
- 882 Harder Rd
- Plan 5-Alt at Fusion - Live-Work Homes
- Plan 5 at Fusion - Live-Work Homes
- Plan 1 at Fusion - Townhomes
- Plan 2 at Fusion - Townhomes
- Plan 6 at Fusion - Live-Work Homes
- Plan 3 at Fusion - Townhomes
- Plan 4 at Fusion - Townhomes
- 27418 Susan Place Unit 3
- 26557 Joshua St
- 232 Edwin Way
- 26470 Jane Ave
- 26578 Jane Ave
- 26565 Joshua St
- 26462 Jane Ave
- 240 Edwin Way
- 525 Cottage Park Dr
- 26586 Jane Ave
- 26573 Joshua St
- 26454 Jane Ave
- 239 Edwin Way
- 244 Edwin Way
- 529 Cottage Park Dr
- 243 Edwin Way
- 26581 Joshua St
- 238 Jacaranda Dr
- 26594 Jane Ave
- 26446 Jane Ave
- 248 Edwin Way