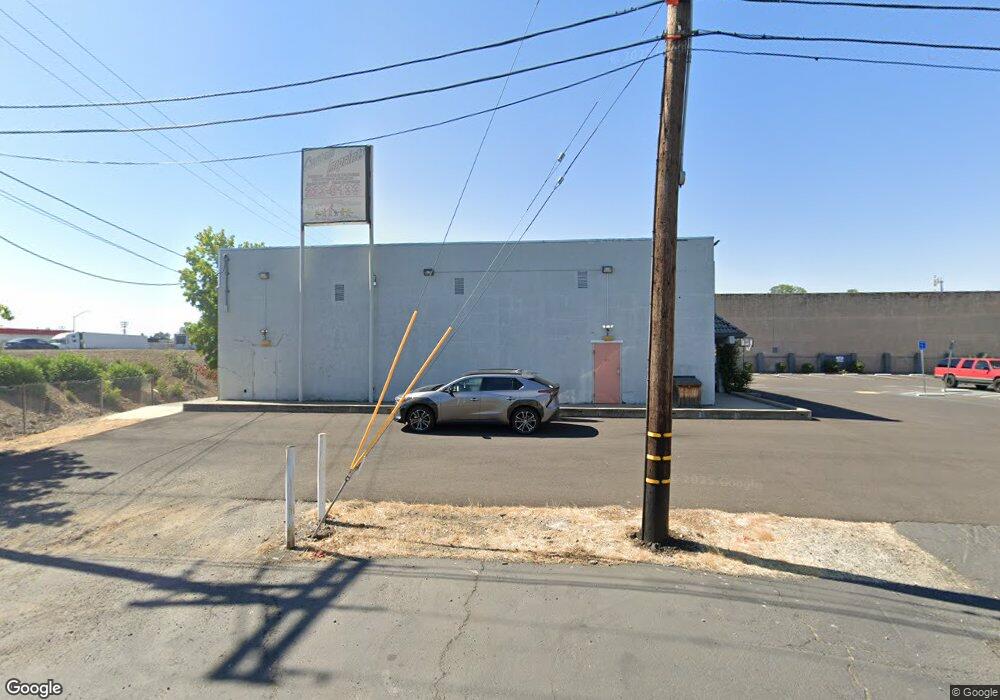
2655 Bechelli Ln Redding, CA 96002
Bechelli Neighborhood
Studio
--
Bath
6,000
Sq Ft
28,750
Sq Ft Lot
About This Home
This home is located at 2655 Bechelli Ln, Redding, CA 96002. 2655 Bechelli Ln is a home located in Shasta County with nearby schools including Rother Elementary School, Parsons Junior High School, and Enterprise High School.
Ownership History
Date
Name
Owned For
Owner Type
Purchase Details
Closed on
Jun 19, 2025
Sold by
Winterburn David
Bought by
David Winterburn Trust and Winterburn
Purchase Details
Closed on
Feb 29, 2024
Sold by
Mary F Winterburn Trust
Bought by
Winterburn David and Winterburn Jon
Purchase Details
Closed on
Dec 18, 2008
Sold by
Baysierra Mortgage Fund Llc
Bought by
Winterburn Mary F
Home Financials for this Owner
Home Financials are based on the most recent Mortgage that was taken out on this home.
Original Mortgage
$418,000
Interest Rate
4.91%
Mortgage Type
Construction
Purchase Details
Closed on
Jun 27, 2007
Sold by
Reynolds Michael L and Reynolds Judy A
Bought by
Baysierra Mortgage Fund Llc
Purchase Details
Closed on
Jun 1, 2000
Sold by
Ochinero Edward & Beatrice Trust
Bought by
Reynolds Michael L and Reynolds Judy A
Home Financials for this Owner
Home Financials are based on the most recent Mortgage that was taken out on this home.
Original Mortgage
$600,000
Interest Rate
8.15%
Mortgage Type
Seller Take Back
Create a Home Valuation Report for This Property
The Home Valuation Report is an in-depth analysis detailing your home's value as well as a comparison with similar homes in the area
Home Values in the Area
Average Home Value in this Area
Purchase History
| Date | Buyer | Sale Price | Title Company |
|---|---|---|---|
| David Winterburn Trust | -- | None Listed On Document | |
| Winterburn David | -- | None Listed On Document | |
| Winterburn Mary F | $575,000 | Fidelity National Title Co | |
| Baysierra Mortgage Fund Llc | $103,322 | None Available | |
| Reynolds Michael L | $600,000 | First American Title Co |
Source: Public Records
Mortgage History
| Date | Status | Borrower | Loan Amount |
|---|---|---|---|
| Previous Owner | Winterburn Mary F | $418,000 | |
| Previous Owner | Reynolds Michael L | $600,000 |
Source: Public Records
Tax History
| Year | Tax Paid | Tax Assessment Tax Assessment Total Assessment is a certain percentage of the fair market value that is determined by local assessors to be the total taxable value of land and additions on the property. | Land | Improvement |
|---|---|---|---|---|
| 2025 | $6,990 | $628,841 | $147,639 | $481,202 |
| 2024 | $6,892 | $616,512 | $144,745 | $471,767 |
| 2023 | $6,892 | $604,424 | $141,907 | $462,517 |
| 2022 | $6,699 | $592,574 | $139,125 | $453,449 |
| 2021 | $6,473 | $580,956 | $136,398 | $444,558 |
| 2020 | $6,444 | $575,000 | $135,000 | $440,000 |
| 2019 | $7,488 | $663,774 | $173,156 | $490,618 |
| 2018 | $7,402 | $650,760 | $169,761 | $480,999 |
| 2017 | $7,531 | $638,001 | $166,433 | $471,568 |
| 2016 | $6,498 | $575,000 | $120,000 | $455,000 |
| 2015 | $5,825 | $510,000 | $100,000 | $410,000 |
| 2014 | $5,784 | $500,000 | $100,000 | $400,000 |
Source: Public Records
Map
Nearby Homes
- 890 Parsons Dr
- 0 Churn Creek Rd Unit 25-496
- 0 Churn Creek Rd Unit 26-609
- 2935 Shotwick Trail
- 3140 C St
- 2861 Shotwick Trail
- 3087 Northwoods Way
- 2590 Henderson Rd
- 1968 Bechelli Ln
- 3081 Henderson Rd
- 1005 Grissom Ct
- 1928 Bechelli Ln
- 1108 4th St
- 2631 Alfreda Way
- 2820 Alfreda Way
- 1075 Le Brun Ln
- 2893 Alfreda Way
- 2855 Irwin Rd
- 350 Park Marina Cir
- 1018 Pineland Dr
- 2675 Bechelli Ln
- 586 Markwood Dr
- 2629 Bechelli Ln
- 2627 Bechelli Ln
- 580 Markwood Dr
- 2647 Bechelli Ln
- 2613 Bechelli Ln
- 566 Markwood Dr
- 2611 Bechelli Ln
- 552 Markwood Dr
- 2609 Bechelli Ln
- 2607 Bechelli Ln
- 2665 Bechelli Ln
- 530 Markwood Dr
- 565 Markwood Dr
- 563 Markwood Dr
- 585 Markwood Dr
- 591 Markwood Dr
- 2685 Bechelli Ln
- 555 Markwood Dr
Your Personal Tour Guide
Ask me questions while you tour the home.