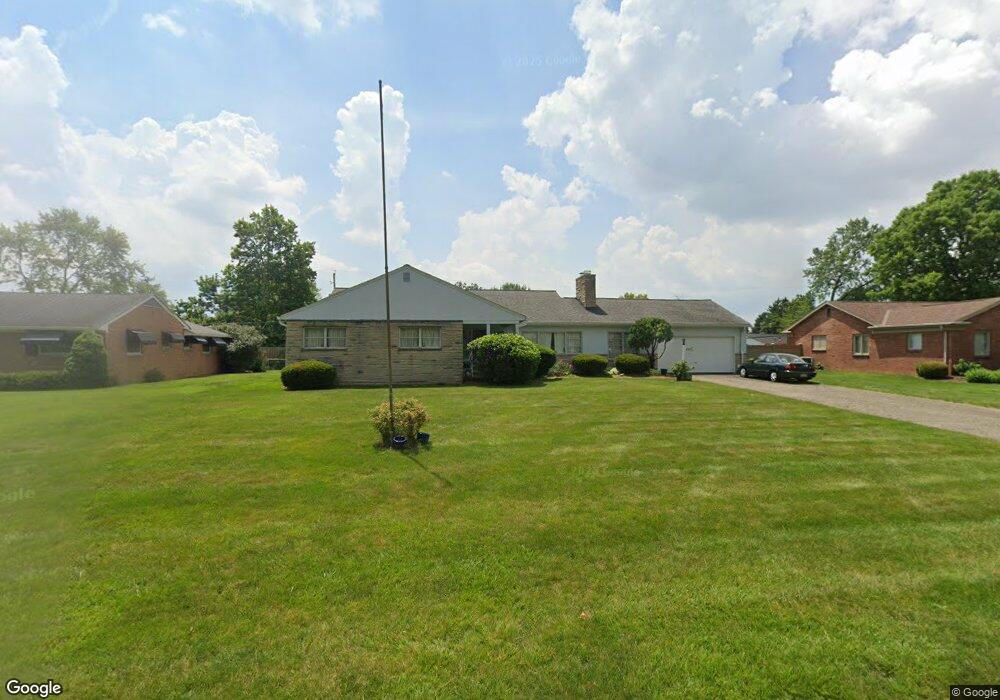
2655 Berwick Blvd Columbus, OH 43209
Berwick NeighborhoodEstimated Value: $400,000 - $493,000
4
Beds
3
Baths
2,950
Sq Ft
$151/Sq Ft
Est. Value
About This Home
This home is located at 2655 Berwick Blvd, Columbus, OH 43209 and is currently estimated at $446,623, approximately $151 per square foot. 2655 Berwick Blvd is a home located in Franklin County with nearby schools including Berwick Alternative K-8 School, Walnut Ridge High School, and Mason Run High School.
Ownership History
Date
Name
Owned For
Owner Type
Purchase Details
Closed on
Apr 8, 2018
Sold by
Gil Ahront
Bought by
Ahroni Gil and Gill Ahroni Revocable Living T
Current Estimated Value
Purchase Details
Closed on
Nov 2, 2017
Sold by
Ahroni Gil and Revocable Living Trust Of Rahe
Bought by
Ahroni Gil
Purchase Details
Closed on
Nov 19, 2015
Sold by
Ahroni Rachel
Bought by
Revocable Living Trust Of Rachel Ahroni
Purchase Details
Closed on
Nov 15, 2015
Sold by
Ahroni Rachel
Bought by
Revocable Living Trust Of Rachel Ahroni
Purchase Details
Closed on
Sep 26, 2000
Sold by
Buchsbaum Robert E and Buchsbaum Mina
Bought by
Ahroni Reuben and Ahroni Rachel
Home Financials for this Owner
Home Financials are based on the most recent Mortgage that was taken out on this home.
Original Mortgage
$110,000
Interest Rate
7.98%
Purchase Details
Closed on
Sep 9, 1980
Bought by
Buchsbaum Robert E
Create a Home Valuation Report for This Property
The Home Valuation Report is an in-depth analysis detailing your home's value as well as a comparison with similar homes in the area
Home Values in the Area
Average Home Value in this Area
Purchase History
| Date | Buyer | Sale Price | Title Company |
|---|---|---|---|
| Ahroni Gil | -- | None Available | |
| Ahroni Gil | -- | None Available | |
| Revocable Living Trust Of Rachel Ahroni | -- | Attorney | |
| Revocable Living Trust Of Rachel Ahroni | -- | Attorney | |
| Ahroni Reuben | $166,500 | -- | |
| Buchsbaum Robert E | -- | -- |
Source: Public Records
Mortgage History
| Date | Status | Borrower | Loan Amount |
|---|---|---|---|
| Previous Owner | Ahroni Reuben | $110,000 |
Source: Public Records
Tax History
| Year | Tax Paid | Tax Assessment Tax Assessment Total Assessment is a certain percentage of the fair market value that is determined by local assessors to be the total taxable value of land and additions on the property. | Land | Improvement |
|---|---|---|---|---|
| 2025 | $5,847 | $130,280 | $39,940 | $90,340 |
| 2024 | $5,847 | $130,280 | $39,940 | $90,340 |
| 2023 | $5,772 | $130,270 | $39,935 | $90,335 |
| 2022 | $4,725 | $91,110 | $26,670 | $64,440 |
| 2021 | $4,734 | $91,110 | $26,670 | $64,440 |
| 2020 | $4,740 | $91,110 | $26,670 | $64,440 |
| 2019 | $4,583 | $75,540 | $22,230 | $53,310 |
| 2018 | $3,878 | $75,540 | $22,230 | $53,310 |
| 2017 | $4,332 | $75,540 | $22,230 | $53,310 |
| 2016 | $4,085 | $61,670 | $14,280 | $47,390 |
| 2015 | $3,182 | $61,670 | $14,280 | $47,390 |
| 2014 | $3,190 | $61,670 | $14,280 | $47,390 |
| 2013 | $1,573 | $61,670 | $14,280 | $47,390 |
Source: Public Records
Map
Nearby Homes
- 1423 Cottingham Ct E
- 2433 Brookwood Rd
- 1455 Wilmore Dr
- 1341 Millerdale Rd
- 2956 Castlewood Rd
- 2731 Sonata Dr
- 2390 Village at Bexley Dr Unit 2390
- 1677 Kenview Rd
- 2393-2395 Dover Rd
- 2639 Halleck Dr
- 2840 Manola Dr
- 1637 S James Rd
- 2963 Brownlee Ave
- 1002 S Cassingham Rd
- 1679 Penfield Rd
- 1106 S James Rd
- 878 Grandon Ave
- 1048 S James Rd
- 789 Chelsea Ave
- 885 Francis Ave
- 2641 Berwick Blvd
- 1395 Wakefield Ct E
- 1397 Wakefield Ct W
- 1393 Wakefield Ct W
- 2629 Berwick Blvd
- 2683 Berwick Blvd
- 2656 Berwick Blvd
- 2666 Berwick Blvd
- 2646 Berwick Blvd
- 1399 Wakefield Ct W
- 2682 Berwick Blvd
- 2615 Berwick Blvd
- 2697 Berwick Blvd
- 1406 Wakefield Ct W
- 1408 Wakefield Ct E
- 1383 Severn Rd
- 1414 Wakefield Ct W
- 2696 Berwick Blvd
- 1395 Severn Rd
- 2651 Wellesley Rd
Your Personal Tour Guide
Ask me questions while you tour the home.