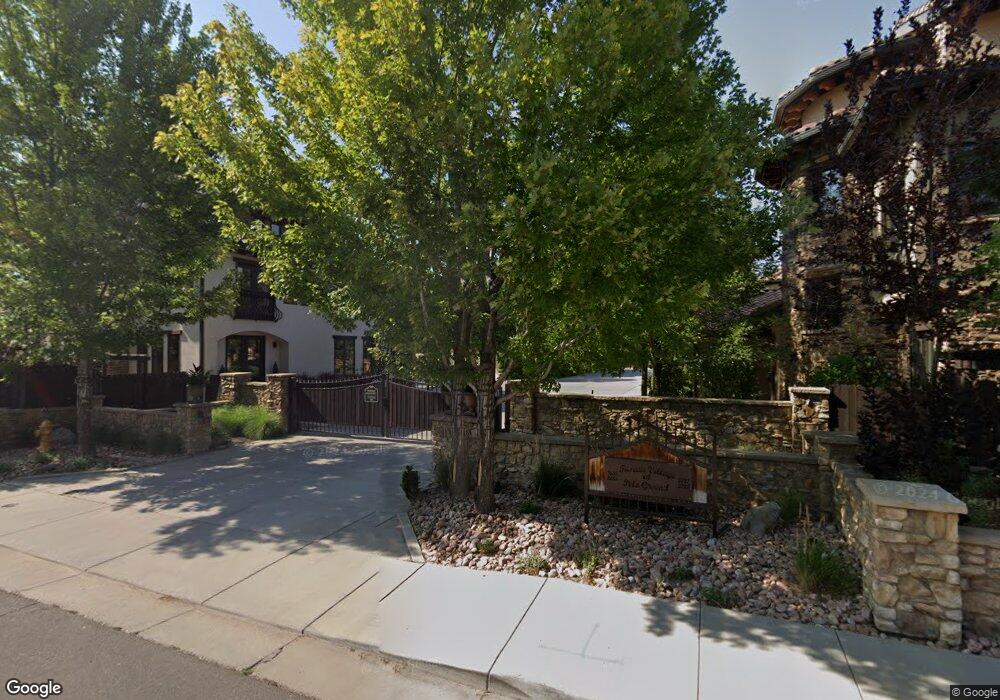
2655 E Alameda Ave Denver, CO 80209
Belcaro NeighborhoodEstimated Value: $3,961,000 - $4,591,000
5
Beds
7
Baths
7,179
Sq Ft
$596/Sq Ft
Est. Value
About This Home
This home is located at 2655 E Alameda Ave, Denver, CO 80209 and is currently estimated at $4,280,658, approximately $596 per square foot. 2655 E Alameda Ave is a home located in Denver County with nearby schools including Cory Elementary School, Merrill Middle School, and South High School.
Ownership History
Date
Name
Owned For
Owner Type
Purchase Details
Closed on
Sep 9, 2020
Sold by
Laughlin Patrick R
Bought by
Kerman Darius and Kerman Shideh
Current Estimated Value
Home Financials for this Owner
Home Financials are based on the most recent Mortgage that was taken out on this home.
Original Mortgage
$2,625,600
Interest Rate
2.8%
Mortgage Type
New Conventional
Purchase Details
Closed on
Jan 29, 2010
Sold by
H & M Mortgage & Investments Llc
Bought by
Laughlin Patrick R
Home Financials for this Owner
Home Financials are based on the most recent Mortgage that was taken out on this home.
Original Mortgage
$485,000
Interest Rate
4.93%
Mortgage Type
Purchase Money Mortgage
Purchase Details
Closed on
Jul 26, 2006
Sold by
Broe Land Acquisitions Iv Llc
Bought by
H & M Mortgage & Investments Llc
Purchase Details
Closed on
Dec 2, 2005
Sold by
Ballen Kathryn and Thompson Linda L
Bought by
Broe Land Acquisitions Iv Llc
Create a Home Valuation Report for This Property
The Home Valuation Report is an in-depth analysis detailing your home's value as well as a comparison with similar homes in the area
Home Values in the Area
Average Home Value in this Area
Purchase History
| Date | Buyer | Sale Price | Title Company |
|---|---|---|---|
| Kerman Darius | $3,282,000 | First American | |
| Laughlin Patrick R | $695,000 | Land Title Guarantee Company | |
| H & M Mortgage & Investments Llc | -- | None Available | |
| Broe Land Acquisitions Iv Llc | $750,000 | -- |
Source: Public Records
Mortgage History
| Date | Status | Borrower | Loan Amount |
|---|---|---|---|
| Previous Owner | Kerman Darius | $2,625,600 | |
| Previous Owner | Laughlin Patrick R | $485,000 |
Source: Public Records
Tax History
| Year | Tax Paid | Tax Assessment Tax Assessment Total Assessment is a certain percentage of the fair market value that is determined by local assessors to be the total taxable value of land and additions on the property. | Land | Improvement |
|---|---|---|---|---|
| 2025 | $21,522 | $340,070 | $71,130 | $71,130 |
| 2024 | $21,522 | $271,730 | $60,840 | $210,890 |
| 2023 | $21,055 | $271,730 | $60,840 | $210,890 |
| 2022 | $18,623 | $234,180 | $54,180 | $180,000 |
| 2021 | $17,977 | $240,920 | $55,740 | $185,180 |
| 2020 | $17,871 | $240,870 | $55,740 | $185,130 |
| 2019 | $17,371 | $240,870 | $55,740 | $185,130 |
| 2018 | $16,425 | $212,310 | $49,530 | $162,780 |
| 2017 | $16,376 | $212,310 | $49,530 | $162,780 |
| 2016 | $18,219 | $223,420 | $43,804 | $179,616 |
Source: Public Records
Map
Nearby Homes
- 2630 E Cedar Ave
- 2880 E Cedar Ave
- 2610 E Cedar Ave
- 2620 E Cedar Ave
- 2600 E Cedar Ave
- 2552 E Alameda Ave Unit 92
- 2552 E Alameda Ave Unit 32
- 2552 E Alameda Ave Unit 31
- 2552 E Alameda Ave Unit 16
- 2552 E Alameda Ave Unit 47
- 2655 E Cedar Ave
- 3131 E Alameda Ave Unit 1006
- 3131 E Alameda Ave Unit 706
- 3131 E Alameda Ave Unit 1003
- 2821 E Cedar Ave Unit 14
- 3100 E Cherry Creek South Dr Unit 801
- 3100 E Cherry Creek South Dr Unit 307
- 3100 E Cherry Creek South Dr Unit 206
- 2700 E Cherry Creek Dr S Unit 108
- 100 S University Blvd Unit 5
- 2635 E Alameda Ave
- 2605 E Alameda Ave
- 2727 E Alameda Ave
- 2729 E Alameda Ave
- 2700 E Cedar Ave
- 2805 E Alameda Ave
- 2555 E Alameda Cir
- 2565 E Alameda Cir
- 2565 E Alameda Cir
- 2815 E Alameda Ave
- 2825 E Alameda Ave
- 2545 E Alameda Cir
- 2895 E Alameda Ave
- 2750 E Cedar Ave
- 2550 E Alameda Cir
- 2550 E Alameda Cir
- 2899 E Alameda Ave
- 2800 E Cedar Ave
- 2535 E Alameda Cir
- 2660 E Cedar Ave
Your Personal Tour Guide
Ask me questions while you tour the home.