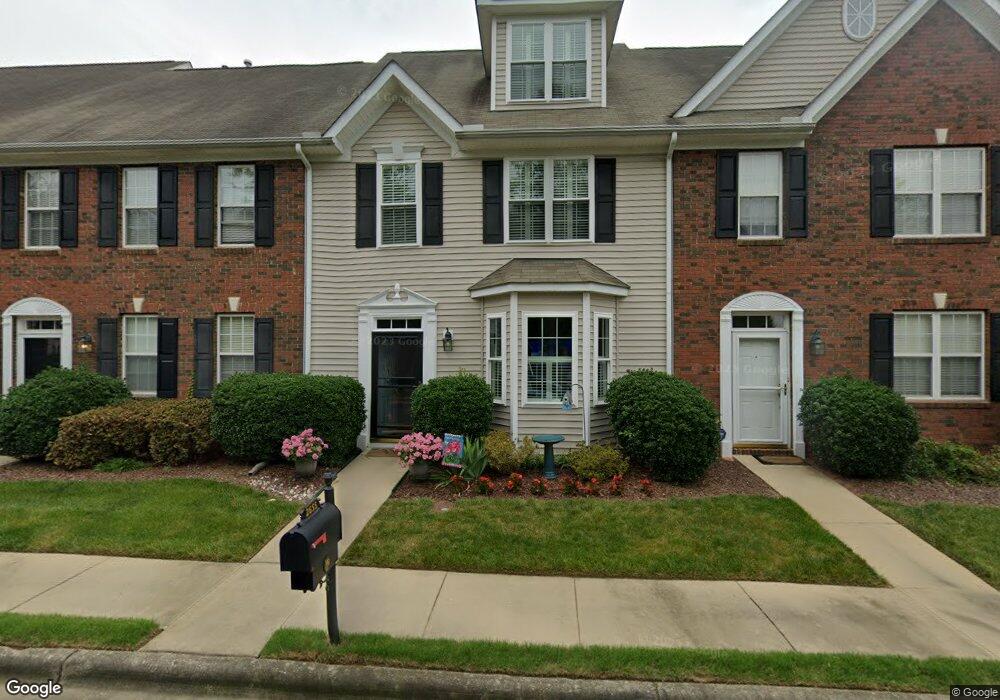
2655 Garden Knoll Ln Raleigh, NC 27614
Falls Lake NeighborhoodEstimated Value: $292,912 - $328,000
3
Beds
3
Baths
2,013
Sq Ft
$154/Sq Ft
Est. Value
About This Home
This home is located at 2655 Garden Knoll Ln, Raleigh, NC 27614 and is currently estimated at $310,478, approximately $154 per square foot. 2655 Garden Knoll Ln is a home located in Wake County with nearby schools including Wakefield Elementary School, Wakefield Middle, and Wakefield High School.
Ownership History
Date
Name
Owned For
Owner Type
Purchase Details
Closed on
May 6, 2021
Sold by
Foley David P and Foley Beverly
Bought by
Foley David and Foley Beverly
Current Estimated Value
Purchase Details
Closed on
Sep 29, 2009
Sold by
Pavia Beverly B
Bought by
Pavia Beverly B and Foley David P
Purchase Details
Closed on
Oct 29, 2004
Sold by
Povlick Michael W and Povlick Mona E
Bought by
Pavia Beverly B
Home Financials for this Owner
Home Financials are based on the most recent Mortgage that was taken out on this home.
Original Mortgage
$144,000
Outstanding Balance
$48,663
Interest Rate
1%
Mortgage Type
New Conventional
Estimated Equity
$261,815
Purchase Details
Closed on
Apr 5, 2001
Sold by
Landmark Homes Inc
Bought by
Povlick Michael W and Povlick Mona E
Home Financials for this Owner
Home Financials are based on the most recent Mortgage that was taken out on this home.
Original Mortgage
$166,655
Interest Rate
6.95%
Create a Home Valuation Report for This Property
The Home Valuation Report is an in-depth analysis detailing your home's value as well as a comparison with similar homes in the area
Home Values in the Area
Average Home Value in this Area
Purchase History
| Date | Buyer | Sale Price | Title Company |
|---|---|---|---|
| Foley David | -- | None Available | |
| Pavia Beverly B | -- | None Available | |
| Pavia Beverly B | $180,000 | -- | |
| Povlick Michael W | $175,500 | -- |
Source: Public Records
Mortgage History
| Date | Status | Borrower | Loan Amount |
|---|---|---|---|
| Open | Pavia Beverly B | $144,000 | |
| Previous Owner | Povlick Michael W | $166,655 |
Source: Public Records
Tax History Compared to Growth
Tax History
| Year | Tax Paid | Tax Assessment Tax Assessment Total Assessment is a certain percentage of the fair market value that is determined by local assessors to be the total taxable value of land and additions on the property. | Land | Improvement |
|---|---|---|---|---|
| 2025 | $2,532 | $288,002 | $60,000 | $228,002 |
| 2024 | $2,521 | $288,002 | $60,000 | $228,002 |
| 2023 | $2,300 | $209,130 | $30,000 | $179,130 |
| 2022 | $2,137 | $209,130 | $30,000 | $179,130 |
| 2021 | $2,055 | $209,130 | $30,000 | $179,130 |
| 2020 | $2,018 | $209,130 | $30,000 | $179,130 |
| 2019 | $1,880 | $160,491 | $22,000 | $138,491 |
| 2018 | $1,774 | $160,491 | $22,000 | $138,491 |
| 2017 | $1,690 | $160,491 | $22,000 | $138,491 |
| 2016 | $1,655 | $160,491 | $22,000 | $138,491 |
| 2015 | $1,821 | $173,932 | $32,000 | $141,932 |
| 2014 | $1,728 | $173,932 | $32,000 | $141,932 |
Source: Public Records
Map
Nearby Homes
- 2658 Garden Knoll Ln
- 2738 Garden Knoll Ln
- 2561 Bent Green St
- 2545 Forest Shadows Ln
- 2541 Forest Shadows Ln
- 3220 Queensland Rd
- 3328 Queensland Rd
- 2220 Spruce Shadows Ln
- 12204 Kaysmount Ct
- 2822 Winter Song Rd
- 12301 Corvus Rd
- 3428 van Hessen Dr
- 12308 Bunchgrass Ln
- 13201 Townfield Dr
- 2704 Snowy Meadow Ct
- 3436 Falls River Ave
- 2116 Covered Bridge Ct
- 12400 Village Gate Way
- 12412 Fieldmist Dr
- 2740 Cloud Mist Cir
- 2653 Garden Knoll Ln
- 2657 Garden Knoll Ln
- 2651 Garden Knoll Ln
- 2647 Garden Knoll Ln
- 2645 Garden Knoll Ln
- 2643 Garden Knoll Ln
- 2645 Vega Ct
- 2643 Vega Ct
- 2647 Vega Ct
- 2654 Garden Knoll Ln
- 2656 Garden Knoll Ln
- 2639 Garden Knoll Ln
- 2652 Garden Knoll Ln
- 2641 Vega Ct
- 2649 Vega Ct
- 2660 Garden Knoll Ln
- 2650 Garden Knoll Ln
- 2650 Garden Knoll Ln Unit Lot 9568
- 2639 Vega Ct
- 2637 Garden Knoll Ln