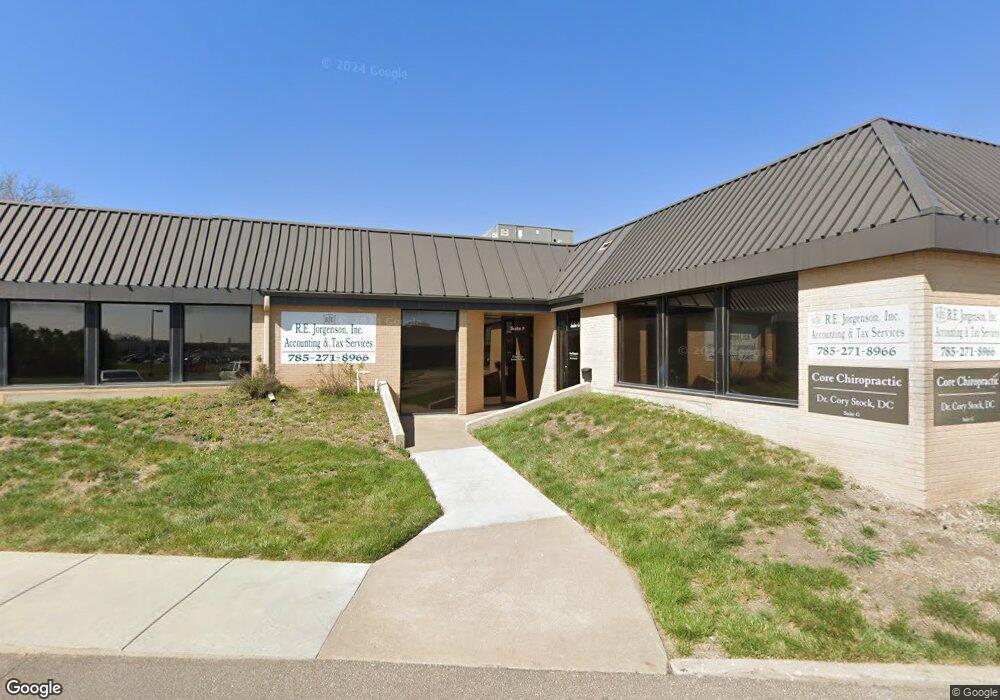
2655 SW Wanamaker Rd Topeka, KS 66614
Southwest Topeka Neighborhood
--
Bed
6
Baths
12,665
Sq Ft
1.43
Acres
About This Home
This home is located at 2655 SW Wanamaker Rd, Topeka, KS 66614. 2655 SW Wanamaker Rd is a home located in Shawnee County with nearby schools including Farley Elementary School, Washburn Rural Middle School, and Washburn Rural High School.
Ownership History
Date
Name
Owned For
Owner Type
Purchase Details
Closed on
Jun 28, 2019
Sold by
Roberts Justin Allen and Roberts Jessica Marie
Bought by
Patrick Freeman Janell C and Patrick Mecafferey
Home Financials for this Owner
Home Financials are based on the most recent Mortgage that was taken out on this home.
Original Mortgage
$184,750
Outstanding Balance
$161,769
Interest Rate
4%
Mortgage Type
New Conventional
Purchase Details
Closed on
Jun 1, 2017
Sold by
Bussard David A
Bought by
Bussard David A and David A Bussard Trust
Purchase Details
Closed on
Feb 16, 2016
Sold by
Tobin Katrina K and Tobin Latrina
Bought by
Tobin Justin
Purchase Details
Closed on
Mar 12, 2015
Sold by
Miser Keven and Miser Pennie S
Bought by
Joens Katie L
Home Financials for this Owner
Home Financials are based on the most recent Mortgage that was taken out on this home.
Original Mortgage
$86,307
Interest Rate
4.4%
Mortgage Type
FHA
Create a Home Valuation Report for This Property
The Home Valuation Report is an in-depth analysis detailing your home's value as well as a comparison with similar homes in the area
Home Values in the Area
Average Home Value in this Area
Purchase History
| Date | Buyer | Sale Price | Title Company |
|---|---|---|---|
| Patrick Freeman Janell C | -- | Security 1St Title | |
| Bussard David A | -- | None Available | |
| Tobin Justin | -- | Security First Title Co | |
| Joens Katie L | -- | Capital Title Ins Company Lc | |
| Miser Keven | -- | Capital Title Ins Company Lc |
Source: Public Records
Mortgage History
| Date | Status | Borrower | Loan Amount |
|---|---|---|---|
| Open | Patrick Freeman Janell C | $184,750 | |
| Previous Owner | Joens Katie L | $86,307 |
Source: Public Records
Tax History Compared to Growth
Tax History
| Year | Tax Paid | Tax Assessment Tax Assessment Total Assessment is a certain percentage of the fair market value that is determined by local assessors to be the total taxable value of land and additions on the property. | Land | Improvement |
|---|---|---|---|---|
| 2025 | $73,438 | $460,776 | -- | -- |
| 2023 | $73,438 | $434,001 | $0 | $0 |
| 2022 | $68,615 | $419,126 | $0 | $0 |
| 2021 | $66,186 | $0 | $0 | $0 |
| 2020 | $43,103 | $271,751 | $0 | $0 |
| 2019 | $43,164 | $271,751 | $0 | $0 |
| 2018 | $42,880 | $270,726 | $0 | $0 |
| 2017 | $43,117 | $269,026 | $0 | $0 |
| 2014 | $45,509 | $280,751 | $0 | $0 |
Source: Public Records
Map
Nearby Homes
- 6040 SW 25th St
- 6054 SW 25th St
- 000 SW Armstrong Ave
- 6351 SW 25th St
- 5719 SW 27th St
- 2504 SW Kingsrow Rd
- 3101 SW Wanamaker Dr Unit 13
- 3101 SW Muirfield Ct
- 8008 SW 26th Terrace Unit Lot 8, Block B
- 8016 SW 26th Terrace Unit Lot 10, Block B
- 2952 SW Woodstock Ln
- 5725 SW Quail Cove Cir
- 2433 SW Camelot Place
- 5623 SW Hawick Ln
- 6516 SW 28th St
- 5859 SW 22nd Terrace Unit 3
- 6549 SW 26th Ct
- 000 U S 75
- 3022 SW Hunters Ln
- 3019 SW Arrowhead Rd
- 6020 SW 27th St
- 2641 SW Wanamaker Rd
- 6017 SW 27th St
- 2701 SW Wanamaker Rd
- 6037 SW 27th St
- 2700 SW Wanamaker Rd
- 6040 SW 27th St
- 2541 SW Brandywine Ln
- 2530 SW Brandywine Ln
- 2735 SW Wanamaker Rd
- 2531 SW Brandywine Ln
- 2524 SW Brandywine Ln
- 6107 SW 26th Ct
- 6105 SW 27th St
- 6101 SW 26th Ct
- 2525 SW Brandywine Ln
- 5990 SW 28th St Unit H
- 5990 SW 28th St
- 6100 SW 26th Ct
- 6113 SW 26th Ct