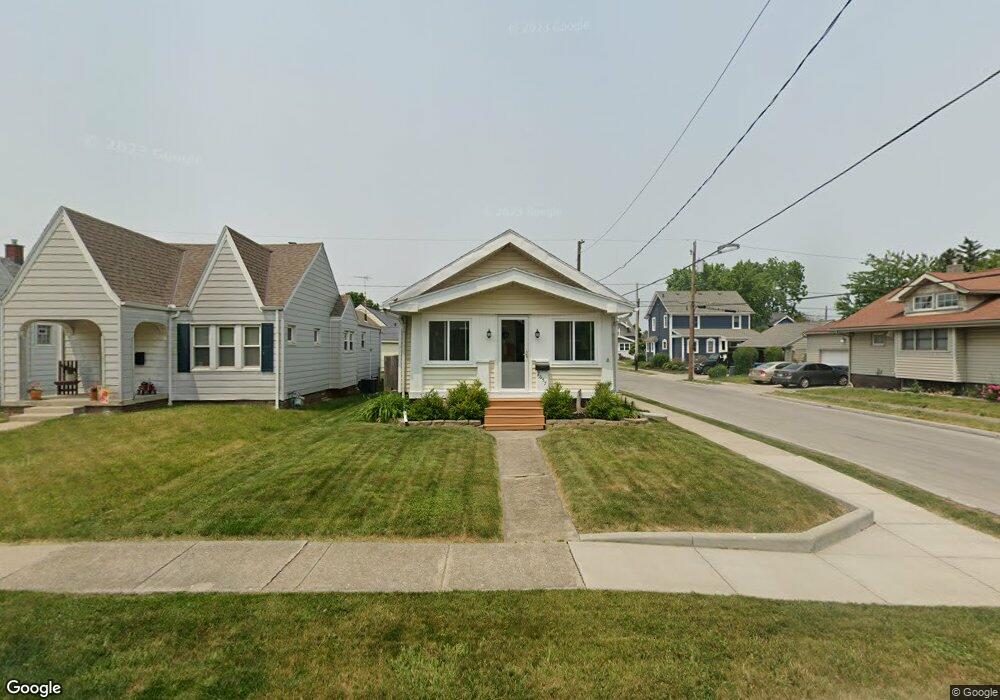
2657 119th St Toledo, OH 43611
Point Place NeighborhoodEstimated Value: $83,000 - $124,000
2
Beds
1
Bath
806
Sq Ft
$131/Sq Ft
Est. Value
About This Home
This home is located at 2657 119th St, Toledo, OH 43611 and is currently estimated at $105,265, approximately $130 per square foot. 2657 119th St is a home located in Lucas County with nearby schools including Edgewater Elementary School, Woodward High School, and Imagine Environmental Science Academy.
Ownership History
Date
Name
Owned For
Owner Type
Purchase Details
Closed on
Jan 5, 2022
Sold by
Justin Zaleski
Bought by
Dusseau Sandra Lee
Current Estimated Value
Purchase Details
Closed on
Aug 13, 2001
Sold by
Zaleski Gregory M and Zaleski Harriett J
Bought by
Zaleski Justin
Home Financials for this Owner
Home Financials are based on the most recent Mortgage that was taken out on this home.
Original Mortgage
$50,000
Interest Rate
5%
Create a Home Valuation Report for This Property
The Home Valuation Report is an in-depth analysis detailing your home's value as well as a comparison with similar homes in the area
Home Values in the Area
Average Home Value in this Area
Purchase History
| Date | Buyer | Sale Price | Title Company |
|---|---|---|---|
| Dusseau Sandra Lee | $54,000 | Hart James H | |
| Zaleski Justin | $50,000 | -- |
Source: Public Records
Mortgage History
| Date | Status | Borrower | Loan Amount |
|---|---|---|---|
| Previous Owner | Zaleski Justin | $50,000 |
Source: Public Records
Tax History Compared to Growth
Tax History
| Year | Tax Paid | Tax Assessment Tax Assessment Total Assessment is a certain percentage of the fair market value that is determined by local assessors to be the total taxable value of land and additions on the property. | Land | Improvement |
|---|---|---|---|---|
| 2024 | $835 | $25,655 | $6,475 | $19,180 |
| 2023 | $1,327 | $18,970 | $5,495 | $13,475 |
| 2022 | $1,354 | $18,970 | $5,495 | $13,475 |
| 2021 | $1,375 | $18,970 | $5,495 | $13,475 |
| 2020 | $1,314 | $15,575 | $4,515 | $11,060 |
| 2019 | $1,270 | $15,575 | $4,515 | $11,060 |
| 2018 | $1,255 | $15,575 | $4,515 | $11,060 |
| 2017 | $1,216 | $14,035 | $4,970 | $9,065 |
| 2016 | $1,233 | $40,100 | $14,200 | $25,900 |
| 2015 | $1,227 | $40,100 | $14,200 | $25,900 |
| 2014 | $907 | $14,040 | $4,970 | $9,070 |
| 2013 | $907 | $14,040 | $4,970 | $9,070 |
Source: Public Records
Map
Nearby Homes