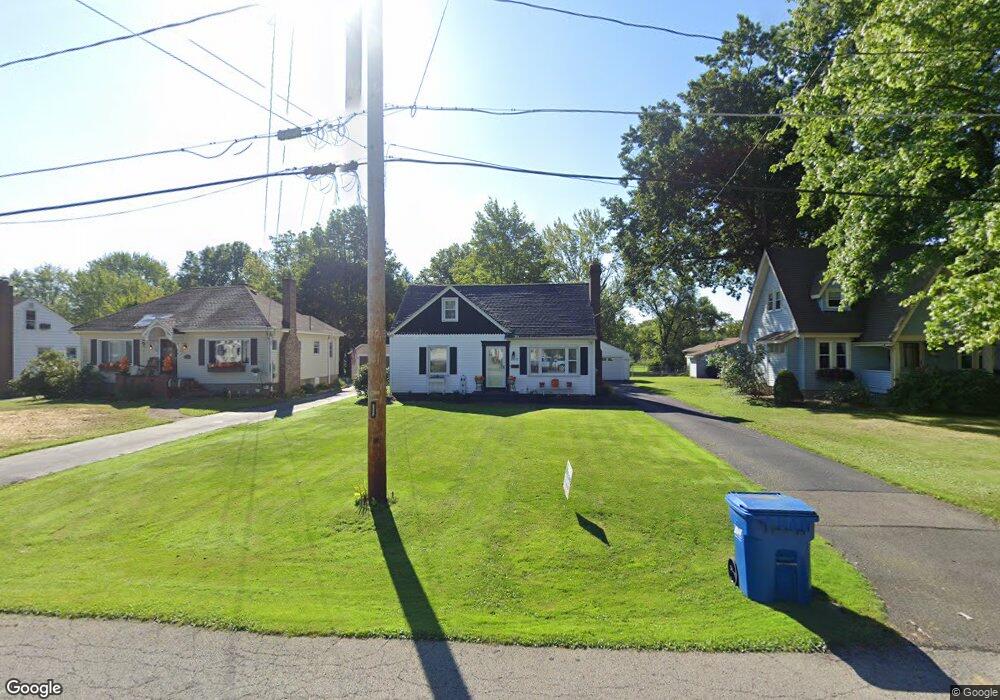
2657 Highland Ave Youngstown, OH 44514
Estimated Value: $206,000 - $256,000
3
Beds
2
Baths
1,256
Sq Ft
$182/Sq Ft
Est. Value
About This Home
This home is located at 2657 Highland Ave, Youngstown, OH 44514 and is currently estimated at $229,025, approximately $182 per square foot. 2657 Highland Ave is a home located in Mahoning County with nearby schools including Poland Union Elementary School, Poland Middle School, and Poland Seminary High School.
Ownership History
Date
Name
Owned For
Owner Type
Purchase Details
Closed on
Apr 12, 2016
Sold by
Compton Mary F
Bought by
Klim Patricia A
Current Estimated Value
Purchase Details
Closed on
Jan 28, 2015
Sold by
Foreman John S
Bought by
Nicholudis Tom
Purchase Details
Closed on
Jan 2, 2014
Sold by
Nicholudis Tom and Nicholudis Tracie
Bought by
Klim Patricia A and Compton Mary F
Home Financials for this Owner
Home Financials are based on the most recent Mortgage that was taken out on this home.
Original Mortgage
$86,487
Interest Rate
4.75%
Mortgage Type
FHA
Purchase Details
Closed on
Apr 9, 2001
Sold by
Begala Edward C
Bought by
Foreman John S
Home Financials for this Owner
Home Financials are based on the most recent Mortgage that was taken out on this home.
Original Mortgage
$96,239
Interest Rate
6.99%
Mortgage Type
FHA
Purchase Details
Closed on
Dec 1, 1992
Bought by
Begala Edward C and Begala Megan
Create a Home Valuation Report for This Property
The Home Valuation Report is an in-depth analysis detailing your home's value as well as a comparison with similar homes in the area
Home Values in the Area
Average Home Value in this Area
Purchase History
| Date | Buyer | Sale Price | Title Company |
|---|---|---|---|
| Klim Patricia A | -- | Attorney | |
| Nicholudis Tom | $60,700 | None Available | |
| Klim Patricia A | $100,000 | Attorney | |
| Foreman John S | $97,000 | -- | |
| Begala Edward C | $65,000 | -- |
Source: Public Records
Mortgage History
| Date | Status | Borrower | Loan Amount |
|---|---|---|---|
| Previous Owner | Klim Patricia A | $86,487 | |
| Previous Owner | Foreman John S | $96,239 |
Source: Public Records
Tax History Compared to Growth
Tax History
| Year | Tax Paid | Tax Assessment Tax Assessment Total Assessment is a certain percentage of the fair market value that is determined by local assessors to be the total taxable value of land and additions on the property. | Land | Improvement |
|---|---|---|---|---|
| 2024 | $2,621 | $52,610 | $9,010 | $43,600 |
| 2023 | $2,561 | $52,610 | $9,010 | $43,600 |
| 2022 | $2,348 | $40,250 | $9,010 | $31,240 |
| 2021 | $2,242 | $40,250 | $9,010 | $31,240 |
| 2020 | $2,251 | $40,250 | $9,010 | $31,240 |
| 2019 | $2,053 | $33,420 | $9,010 | $24,410 |
| 2018 | $1,929 | $33,420 | $9,010 | $24,410 |
| 2017 | $1,886 | $33,420 | $9,010 | $24,410 |
| 2016 | $1,836 | $30,910 | $9,010 | $21,900 |
| 2015 | $1,846 | $30,910 | $9,010 | $21,900 |
| 2014 | $1,805 | $30,910 | $9,010 | $21,900 |
| 2013 | $1,948 | $30,910 | $9,010 | $21,900 |
Source: Public Records
Map
Nearby Homes
- 7143 Youngstown Pittsburgh Rd
- 7109 Youngstown Pittsburgh Rd
- 7085 Youngstown Pittsburgh Rd
- 2829 Poland Village Blvd
- 7240 Oak Dr
- 20 Nesbitt St
- 3064 Howell Dr
- 7214 Clovermeade Ave
- 6845 Katahdin Dr
- 7435 Forest Hill Ave
- 7108 Indian Trail
- 2667 Center Rd
- 2959 Holyoke Dr
- 2831 Center Rd
- 6666 Clingan Rd
- 6695 Clingan Rd Unit 24
- 6695 Clingan Rd Unit 32
- 6695 Clingan Rd Unit 10
- 6695 Clingan Rd Unit 4
- 7354 Yellow Creek Dr
- 2667 Highland Ave
- 2647 Highland Ave
- 2677 Highland Ave
- 2633 Highland Ave
- 2689 Highland Ave
- 2670 Highland Ave
- 7231 Youngstown Pittsburgh Rd
- 2699 Highland Ave
- 2660 Highland Ave
- 7183 Youngstown Pittsburgh Rd
- 7217 Youngstown Pittsburgh Rd
- 2680 Highland Ave
- 2690 Highland Ave
- 2711 Highland Ave
- 7171 Youngstown Pittsburgh Rd
- 7249 Youngstown Pittsburgh Rd
- 2698 Highland Ave
- 7157 Youngstown Pittsburgh Rd
- 2720 Highland Ave
- 7210 Youngstown Pittsburgh Rd