2657 Meade St Denver, CO 80211
Sloan Lake NeighborhoodEstimated Value: $523,000 - $608,000
2
Beds
1
Bath
1,014
Sq Ft
$550/Sq Ft
Est. Value
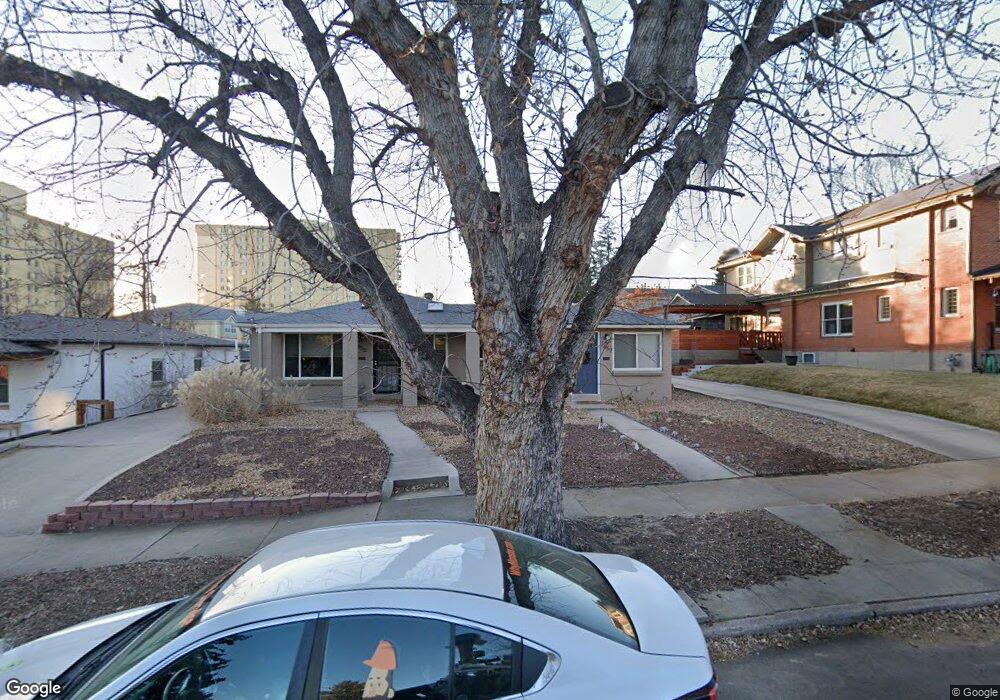
About This Home
This home is located at 2657 Meade St, Denver, CO 80211 and is currently estimated at $558,164, approximately $550 per square foot. 2657 Meade St is a home located in Denver County with nearby schools including Brown International Academy, Bryant Webster Dual Language School, and Skinner Middle School.
Ownership History
Date
Name
Owned For
Owner Type
Purchase Details
Closed on
Nov 4, 2016
Sold by
Thorsen Eric
Bought by
Fry Bradley R
Current Estimated Value
Home Financials for this Owner
Home Financials are based on the most recent Mortgage that was taken out on this home.
Original Mortgage
$354,350
Outstanding Balance
$281,410
Interest Rate
3.42%
Mortgage Type
New Conventional
Estimated Equity
$276,754
Purchase Details
Closed on
Jul 28, 2011
Sold by
Ford Peter B and Ford Kristen S
Bought by
Thorsen Eric
Home Financials for this Owner
Home Financials are based on the most recent Mortgage that was taken out on this home.
Original Mortgage
$193,200
Interest Rate
3%
Mortgage Type
New Conventional
Purchase Details
Closed on
Sep 25, 2009
Sold by
P I Investments Llc
Bought by
Ford Peter B and Ford Kristen S
Home Financials for this Owner
Home Financials are based on the most recent Mortgage that was taken out on this home.
Original Mortgage
$233,689
Interest Rate
5.12%
Mortgage Type
FHA
Create a Home Valuation Report for This Property
The Home Valuation Report is an in-depth analysis detailing your home's value as well as a comparison with similar homes in the area
Home Values in the Area
Average Home Value in this Area
Purchase History
| Date | Buyer | Sale Price | Title Company |
|---|---|---|---|
| Fry Bradley R | $373,000 | Land Title Guarantee | |
| Thorsen Eric | $241,500 | None Available | |
| Ford Peter B | $238,000 | Enterprise Title | |
| Pi Investments Llc | -- | None Available |
Source: Public Records
Mortgage History
| Date | Status | Borrower | Loan Amount |
|---|---|---|---|
| Open | Fry Bradley R | $354,350 | |
| Previous Owner | Thorsen Eric | $193,200 | |
| Previous Owner | Ford Peter B | $233,689 |
Source: Public Records
Tax History
| Year | Tax Paid | Tax Assessment Tax Assessment Total Assessment is a certain percentage of the fair market value that is determined by local assessors to be the total taxable value of land and additions on the property. | Land | Improvement |
|---|---|---|---|---|
| 2025 | $2,821 | $38,300 | $18,810 | $18,810 |
| 2024 | $2,821 | $35,620 | $15,130 | $20,490 |
| 2023 | $2,760 | $35,620 | $15,130 | $20,490 |
| 2022 | $2,577 | $32,400 | $15,610 | $16,790 |
| 2021 | $2,487 | $33,330 | $16,060 | $17,270 |
| 2020 | $2,196 | $29,600 | $15,060 | $14,540 |
| 2019 | $2,135 | $29,600 | $15,060 | $14,540 |
| 2018 | $2,090 | $27,010 | $12,130 | $14,880 |
| 2017 | $2,083 | $27,010 | $12,130 | $14,880 |
| 2016 | $1,958 | $24,010 | $10,061 | $13,949 |
| 2015 | $1,876 | $24,780 | $10,061 | $14,719 |
| 2014 | $1,446 | $17,410 | $6,320 | $11,090 |
Source: Public Records
Map
Nearby Homes
- 3636 W 26th Ave
- 2725 King St
- 2826 Lowell Blvd
- 3622 W 29th Ave
- 2645 Osceola St
- 3434 W 26th Ave
- 2630 N Perry St
- 2772 Julian St
- 3926 W 29th Ave
- 3924 W 29th Ave
- 3450 W Hayward Place
- 3380 W 29th Ave
- 2912 Perry St
- 3915 W Byron Place
- 2453 Julian St
- 3930 W Byron Place
- 2334 Lowell Blvd
- 2712 Irving St
- 4041 W Hayward Place
- 2701 Hooker St
Your Personal Tour Guide
Ask me questions while you tour the home.