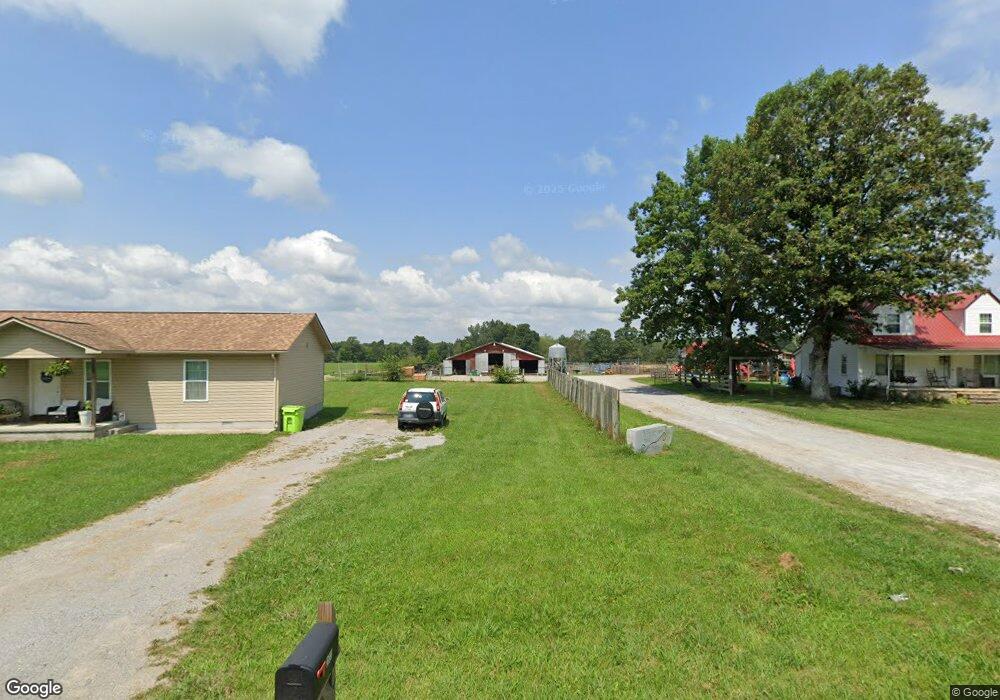
2657 Pomona Rd Crossville, TN 38571
Estimated Value: $309,000 - $371,000
3
Beds
1
Bath
1,792
Sq Ft
$185/Sq Ft
Est. Value
About This Home
This home is located at 2657 Pomona Rd, Crossville, TN 38571 and is currently estimated at $331,806, approximately $185 per square foot. 2657 Pomona Rd is a home located in Cumberland County with nearby schools including Pleasant Hill Elementary School and Cumberland County High School.
Ownership History
Date
Name
Owned For
Owner Type
Purchase Details
Closed on
Aug 1, 2022
Sold by
Arf Ii Llc
Bought by
Belvin Mckinnley and Belvin Tiffany
Current Estimated Value
Home Financials for this Owner
Home Financials are based on the most recent Mortgage that was taken out on this home.
Original Mortgage
$269,000
Outstanding Balance
$256,777
Interest Rate
5.81%
Mortgage Type
New Conventional
Estimated Equity
$75,029
Purchase Details
Closed on
May 8, 2015
Sold by
Findley Anthony
Bought by
Arf Ii Llc
Purchase Details
Closed on
Mar 24, 2010
Sold by
Emery Jennifer Lynn
Bought by
Findley Anthony
Purchase Details
Closed on
Nov 2, 2005
Sold by
Copeland Burxie A
Bought by
Cook Ronald L
Home Financials for this Owner
Home Financials are based on the most recent Mortgage that was taken out on this home.
Original Mortgage
$192,500
Interest Rate
5.9%
Purchase Details
Closed on
Nov 1, 2005
Bought by
Cook Ronald
Home Financials for this Owner
Home Financials are based on the most recent Mortgage that was taken out on this home.
Original Mortgage
$192,500
Interest Rate
5.9%
Create a Home Valuation Report for This Property
The Home Valuation Report is an in-depth analysis detailing your home's value as well as a comparison with similar homes in the area
Home Values in the Area
Average Home Value in this Area
Purchase History
| Date | Buyer | Sale Price | Title Company |
|---|---|---|---|
| Belvin Mckinnley | $269,000 | None Listed On Document | |
| Arf Ii Llc | -- | -- | |
| Findley Anthony | $329,600 | -- | |
| Cook Ronald L | $275,000 | -- | |
| Cook Ronald | $275,000 | -- |
Source: Public Records
Mortgage History
| Date | Status | Borrower | Loan Amount |
|---|---|---|---|
| Open | Belvin Mckinnley | $269,000 | |
| Previous Owner | Cook Ronald | $192,500 | |
| Previous Owner | Cook Ronald | $192,500 |
Source: Public Records
Tax History Compared to Growth
Tax History
| Year | Tax Paid | Tax Assessment Tax Assessment Total Assessment is a certain percentage of the fair market value that is determined by local assessors to be the total taxable value of land and additions on the property. | Land | Improvement |
|---|---|---|---|---|
| 2025 | $1,028 | $90,600 | $4,450 | $86,150 |
| 2024 | $1,028 | $90,600 | $4,450 | $86,150 |
| 2023 | $1,028 | $90,600 | $0 | $0 |
| 2022 | $1,542 | $135,875 | $24,250 | $111,625 |
| 2021 | $1,496 | $95,575 | $22,175 | $73,400 |
| 2020 | $1,496 | $95,575 | $22,175 | $73,400 |
| 2019 | $1,496 | $95,575 | $22,175 | $73,400 |
| 2018 | $1,496 | $95,575 | $22,175 | $73,400 |
| 2017 | $1,496 | $95,575 | $22,175 | $73,400 |
| 2016 | $399 | $26,125 | $14,125 | $12,000 |
| 2015 | $391 | $26,125 | $14,125 | $12,000 |
| 2014 | $387 | $25,847 | $0 | $0 |
Source: Public Records
Map
Nearby Homes
- 104 Lakyn Dr
- 323 Noah Ln
- 0 Hwy 70 N Unit 1317197
- 6419 Highway 70 N
- 37 Windy Acres Dr
- 0 Old Tanner Cemetery Rd Unit 239306
- 0 Old Tanner Cemetery Rd Unit 239305
- 0 Old Tanner Cemetery Rd Unit 239308
- 185 Tanglewood Trail
- 1215 Pomona Rd
- 871 Pomona Rd
- 5.76 Pomona Rd
- 0 Bell Rd
- 458 Pomona Rd
- 1447 Dykes Rd
- 0 Creek Ridge Cove Unit RTC2493017
- 0 Creek Ridge Cove Unit RTC2492982
- 614 W Creston Rd
- 181 Pomona Rd
- 281 Red Williams Rd
- 34 Lakyn Dr
- 2590 Pomona Rd
- 2706 Pomona Rd
- 2715 Pomona Rd
- 56 Lakyn Dr
- 2728 Pomona Rd
- 0 Lakyn Dr Unit 1250767
- 67 Lakyn Dr
- 2757 Pomona Rd
- 94 Lakyn Dr
- 79 Lakyn Dr
- 101 Lakyn Dr
- 126 Lakyn Dr
- 2576 Pomona Rd
- 135 Archie Tate Farm Rd
- 2485 Pomona Rd
- 2794 Pomona Rd
- 2758 Pomona Rd
- 2821 Pomona Rd
- 185 Archie Tate Farm Rd