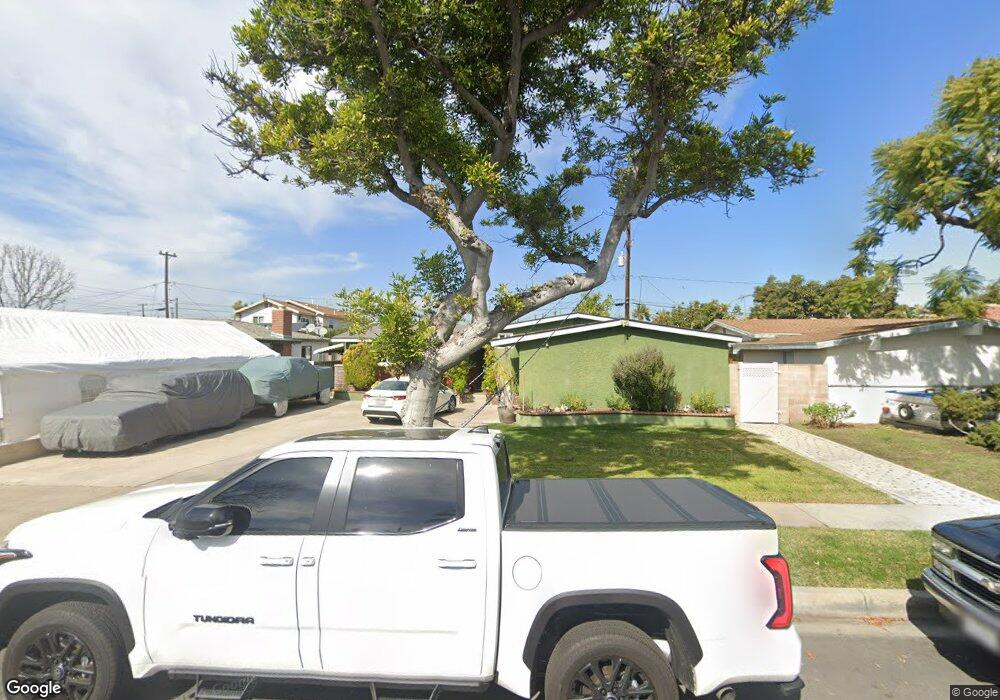
2657 W Yale Ave Anaheim, CA 92801
Northwest Anaheim NeighborhoodEstimated Value: $840,000 - $901,000
3
Beds
2
Baths
1,694
Sq Ft
$510/Sq Ft
Est. Value
About This Home
This home is located at 2657 W Yale Ave, Anaheim, CA 92801 and is currently estimated at $864,750, approximately $510 per square foot. 2657 W Yale Ave is a home located in Orange County with nearby schools including Dr. Peter Marshall Elementary School, Dale Jr High School, and Savanna High School.
Ownership History
Date
Name
Owned For
Owner Type
Purchase Details
Closed on
Jun 28, 2020
Sold by
Perez Rosa Maria and Perez Rosa
Bought by
Perez Rosa Maria and The Rosa Maria Perez Revocable
Current Estimated Value
Purchase Details
Closed on
Jul 16, 2001
Sold by
Rodriguez Federico and Perez Rosa
Bought by
Perez Rosa
Purchase Details
Closed on
Jan 29, 1995
Sold by
Rodriguez Agustin and Rojas Ofelia
Bought by
Rodriguez Federico and Perez Rosa
Purchase Details
Closed on
Dec 14, 1993
Sold by
Federal National Mortgage Association
Bought by
Rodriguez Federico and Perez Rosa
Home Financials for this Owner
Home Financials are based on the most recent Mortgage that was taken out on this home.
Original Mortgage
$150,350
Interest Rate
7.29%
Purchase Details
Closed on
Jul 12, 1993
Sold by
T D Service Company
Bought by
Federal National Mortgage Association
Create a Home Valuation Report for This Property
The Home Valuation Report is an in-depth analysis detailing your home's value as well as a comparison with similar homes in the area
Home Values in the Area
Average Home Value in this Area
Purchase History
| Date | Buyer | Sale Price | Title Company |
|---|---|---|---|
| Perez Rosa Maria | -- | None Available | |
| Perez Rosa | -- | -- | |
| Rodriguez Federico | -- | -- | |
| Rodriguez Federico | $155,000 | Orange Coast Title | |
| Federal National Mortgage Association | $181,575 | Benefit Land Title Co |
Source: Public Records
Mortgage History
| Date | Status | Borrower | Loan Amount |
|---|---|---|---|
| Closed | Rodriguez Federico | $150,350 |
Source: Public Records
Tax History Compared to Growth
Tax History
| Year | Tax Paid | Tax Assessment Tax Assessment Total Assessment is a certain percentage of the fair market value that is determined by local assessors to be the total taxable value of land and additions on the property. | Land | Improvement |
|---|---|---|---|---|
| 2025 | $3,403 | $291,380 | $200,218 | $91,162 |
| 2024 | $3,403 | $285,667 | $196,292 | $89,375 |
| 2023 | $3,313 | $280,066 | $192,443 | $87,623 |
| 2022 | $3,276 | $274,575 | $188,670 | $85,905 |
| 2021 | $3,236 | $269,192 | $184,971 | $84,221 |
| 2020 | $3,217 | $266,432 | $183,074 | $83,358 |
| 2019 | $3,139 | $261,208 | $179,484 | $81,724 |
| 2018 | $3,100 | $256,087 | $175,965 | $80,122 |
| 2017 | $2,992 | $251,066 | $172,515 | $78,551 |
| 2016 | $2,976 | $246,144 | $169,133 | $77,011 |
| 2015 | $2,949 | $242,447 | $166,592 | $75,855 |
| 2014 | $2,804 | $237,698 | $163,328 | $74,370 |
Source: Public Records
Map
Nearby Homes
- 199 N Magnolia Ave Unit B
- 2709 W Madison Cir
- 400 N Syracuse St
- 134 S Magnolia Ave Unit 4C
- 2625 W Cameron Ct Unit 121
- 605 N La Reina St
- 2770 W Lincoln Ave Unit 29A
- 2770 W Lincoln Ave Unit 40
- 2770 W Lincoln Ave Unit 58
- 2513 W Fulcrum Place
- 2871 W Tyler Ave
- 2544 W Greenacre Ave
- 2550 W Rowland Ave
- 2955 W Lincoln Ave Unit 7
- 525 N Gilbert St Unit 106
- 525 N Gilbert St Unit 151
- 8319 Hickory Dr
- 2432 W Transit Ave
- 2943 W Lincoln Ave
- 2435 W Broadway
- 2653 W Yale Ave
- 2661 W Yale Ave
- 2656 W Bruce Ave
- 2660 W Bruce Ave
- 2652 W Bruce Ave
- 2649 W Yale Ave
- 2665 W Yale Ave
- 2648 W Bruce Ave
- 2664 W Bruce Ave
- 2656 W Yale Ave
- 2660 W Yale Ave
- 2652 W Yale Ave
- 2645 W Yale Ave
- 2669 W Yale Ave
- 2664 W Yale Ave
- 2648 W Yale Ave
- 2668 W Bruce Ave
- 2644 W Bruce Ave
- 2668 W Yale Ave
- 2644 W Yale Ave