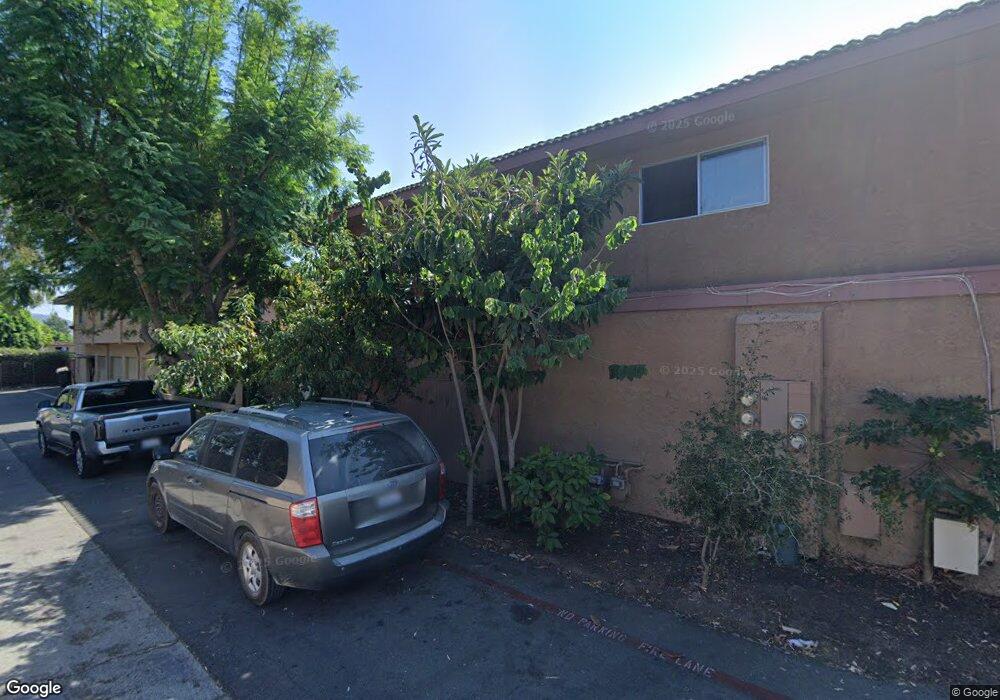
26575 La Zanja St San Juan Capistrano, CA 92675
Estimated Value: $544,571 - $560,000
2
Beds
1
Bath
1,037
Sq Ft
$532/Sq Ft
Est. Value
About This Home
This home is located at 26575 La Zanja St, San Juan Capistrano, CA 92675 and is currently estimated at $552,143, approximately $532 per square foot. 26575 La Zanja St is a home located in Orange County with nearby schools including Kinoshita Elementary School, Marco Forster Middle School, and Capistrano Valley High School.
Ownership History
Date
Name
Owned For
Owner Type
Purchase Details
Closed on
Aug 4, 2011
Sold by
Mendoza Rafael
Bought by
Calpac Properties Llc
Current Estimated Value
Purchase Details
Closed on
May 3, 2006
Sold by
Mendoza Rafael and Mendoza Teresita C
Bought by
Mendoza Rafael
Home Financials for this Owner
Home Financials are based on the most recent Mortgage that was taken out on this home.
Original Mortgage
$282,750
Interest Rate
6.3%
Mortgage Type
New Conventional
Purchase Details
Closed on
Jan 3, 2002
Sold by
Mendoza Rafael M and Mendoza Teresita C
Bought by
Mendoza Rafael and Mendoza Teresita C
Home Financials for this Owner
Home Financials are based on the most recent Mortgage that was taken out on this home.
Original Mortgage
$74,500
Interest Rate
7.01%
Create a Home Valuation Report for This Property
The Home Valuation Report is an in-depth analysis detailing your home's value as well as a comparison with similar homes in the area
Home Values in the Area
Average Home Value in this Area
Purchase History
| Date | Buyer | Sale Price | Title Company |
|---|---|---|---|
| Calpac Properties Llc | $129,000 | None Available | |
| Mendoza Rafael | -- | Ticor Title Company | |
| Mendoza Rafael | -- | First American Title |
Source: Public Records
Mortgage History
| Date | Status | Borrower | Loan Amount |
|---|---|---|---|
| Previous Owner | Mendoza Rafael | $282,750 | |
| Previous Owner | Mendoza Rafael | $74,500 |
Source: Public Records
Tax History Compared to Growth
Tax History
| Year | Tax Paid | Tax Assessment Tax Assessment Total Assessment is a certain percentage of the fair market value that is determined by local assessors to be the total taxable value of land and additions on the property. | Land | Improvement |
|---|---|---|---|---|
| 2025 | $1,916 | $188,401 | $121,452 | $66,949 |
| 2024 | $1,916 | $184,707 | $119,070 | $65,637 |
| 2023 | $1,877 | $181,086 | $116,736 | $64,350 |
| 2022 | $1,844 | $177,536 | $114,447 | $63,089 |
| 2021 | $1,810 | $174,055 | $112,203 | $61,852 |
| 2020 | $1,794 | $172,271 | $111,053 | $61,218 |
| 2019 | $1,761 | $168,894 | $108,876 | $60,018 |
| 2018 | $1,729 | $165,583 | $106,741 | $58,842 |
| 2017 | $1,713 | $162,337 | $104,648 | $57,689 |
| 2016 | $1,682 | $159,154 | $102,596 | $56,558 |
| 2015 | $1,656 | $156,764 | $101,055 | $55,709 |
| 2014 | $1,627 | $153,694 | $99,076 | $54,618 |
Source: Public Records
Map
Nearby Homes
- 31284 Calle San Juan Unit 14
- 31278 Calle San Juan Unit 12
- 31377 Los Rios St Unit 64
- 31261 Paseo Olivos
- 26468 Calle San Antonio
- 31121 Via Santo Tomas
- 26447 Paseo Carmel Unit 11D
- 31595 Los Rios St Unit 78
- 0 Aguacate Rd Unit 25558127
- 31024 Calle San Diego Unit 94b
- 31608 Los Rios St Unit 147
- 31462 La Matanza St
- 31527 Aguacate Rd
- 30828 Calle Chueca
- 30981 Via Mirador
- 27381 Via Priorato
- 90 Plaza de Las Flores
- 70 Plaza Cuesta
- 32011 Via Tonada Unit 9
- 30671 Marbella Vista
- 26571 La Zanja St Unit 37
- 26577 La Zanja St Unit 40F
- 26573 La Zanja St Unit 38B
- 26565 La Zanja St Unit 35
- 26561 La Zanja St
- 26567 La Zanja St Unit 36
- 26563 La Zanja St Unit 34
- 26583 La Zanja St Unit 42B
- 26581 La Zanja St Unit 41
- 26587 La Zanja St Unit 44F
- 26558 Calle San Francisco Unit 20
- 26585 La Zanja St Unit 43
- 26548 Calle San Francisco Unit 24
- 26553 La Zanja St Unit 30B
- 26556 Calle San Francisco Unit 19c
- 26556 Calle San Francisco
- 26554 Calle San Francisco Unit 11
- 26551 La Zanja St Unit 29
- 26546 Calle San Francisco Unit 23C
- 26557 La Zanja St Unit 32F