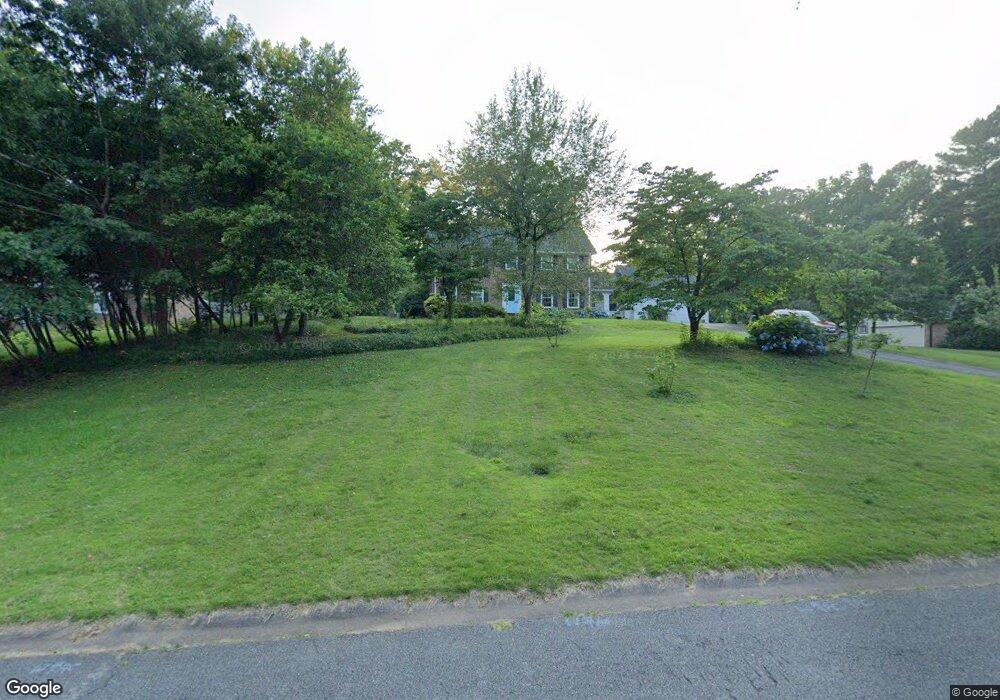
2659 Beckwith Trail South E Marietta, GA 30068
East Cobb NeighborhoodEstimated Value: $588,000 - $686,000
4
Beds
3
Baths
2,688
Sq Ft
$237/Sq Ft
Est. Value
About This Home
This home is located at 2659 Beckwith Trail South E, Marietta, GA 30068 and is currently estimated at $636,406, approximately $236 per square foot. 2659 Beckwith Trail South E is a home located in Cobb County with nearby schools including Eastvalley Elementary School, East Cobb Middle School, and Wheeler High School.
Ownership History
Date
Name
Owned For
Owner Type
Purchase Details
Closed on
Aug 5, 2010
Sold by
Hansz Sean
Bought by
Tacher Julian Y and Feanny Deborah
Current Estimated Value
Home Financials for this Owner
Home Financials are based on the most recent Mortgage that was taken out on this home.
Original Mortgage
$80,000
Interest Rate
4.7%
Mortgage Type
New Conventional
Purchase Details
Closed on
Feb 24, 2006
Sold by
Young Carol A Trust & +
Bought by
Hansz Sean and Lin Winifred
Home Financials for this Owner
Home Financials are based on the most recent Mortgage that was taken out on this home.
Original Mortgage
$214,940
Interest Rate
6.04%
Mortgage Type
New Conventional
Purchase Details
Closed on
Jul 23, 2004
Sold by
Mclaughlin Maureen T
Bought by
Mclaughlin Maureen T Trust
Purchase Details
Closed on
Dec 9, 1996
Sold by
Kane Williamk Patricia
Bought by
Mclaughlin Maureen T and Young Carol
Create a Home Valuation Report for This Property
The Home Valuation Report is an in-depth analysis detailing your home's value as well as a comparison with similar homes in the area
Home Values in the Area
Average Home Value in this Area
Purchase History
| Date | Buyer | Sale Price | Title Company |
|---|---|---|---|
| Tacher Julian Y | $255,000 | -- | |
| Hansz Sean | $268,700 | -- | |
| Mclaughlin Maureen T Trust | -- | -- | |
| Young Carol A Trust | -- | -- | |
| Young Carol A | -- | -- | |
| Mclaughlin Maureen T | $178,500 | -- |
Source: Public Records
Mortgage History
| Date | Status | Borrower | Loan Amount |
|---|---|---|---|
| Closed | Tacher Julian Y | $80,000 | |
| Previous Owner | Hansz Sean | $214,940 | |
| Closed | Mclaughlin Maureen T | $0 |
Source: Public Records
Tax History Compared to Growth
Tax History
| Year | Tax Paid | Tax Assessment Tax Assessment Total Assessment is a certain percentage of the fair market value that is determined by local assessors to be the total taxable value of land and additions on the property. | Land | Improvement |
|---|---|---|---|---|
| 2025 | $4,058 | $166,512 | $48,000 | $118,512 |
| 2024 | $4,500 | $186,752 | $40,000 | $146,752 |
| 2023 | $3,957 | $186,752 | $40,000 | $146,752 |
| 2022 | $4,186 | $170,784 | $40,000 | $130,784 |
| 2021 | $3,524 | $140,540 | $40,000 | $100,540 |
| 2020 | $3,102 | $121,252 | $40,000 | $81,252 |
| 2019 | $3,102 | $121,252 | $40,000 | $81,252 |
| 2018 | $2,711 | $103,388 | $22,000 | $81,388 |
| 2017 | $2,593 | $103,388 | $22,000 | $81,388 |
| 2016 | $2,313 | $90,564 | $22,000 | $68,564 |
| 2015 | $2,370 | $90,564 | $22,000 | $68,564 |
| 2014 | $2,412 | $91,596 | $0 | $0 |
Source: Public Records
Map
Nearby Homes
- 2827 Beverly Hills Dr NE
- 2915 Sope Creek Dr
- 3040 Clearbrook Dr
- 310 Clear Spring Ct
- 165 Spring Field Ln Unit 2
- 302 Chase Ln
- 640 Maddie Way
- 361 Clear Spring Ct
- 2431 Weatherford Ct
- 2672 Roswell Rd
- 2650 Roswell Rd
- 180 Blue Sky Dr
- 420 Greenfield Trace
- 860 Mitsy Ridge Dr
- 1043 Sterling Ridge Chase NE
- 1043 Sterling Ridge Chase
- 2265 Fremont Dr
- 3165 Brookview Dr
- 909 Sunny Meadows Ln
- 925 Sunny Meadows Ln
- 2659 Beckwith Trail SE
- 2669 Beckwith Trail SE
- 2651 Beckwith Trail SE Unit 6
- 2660 Beckwith Trail SE Unit 6
- 524 Flintwood Dr NE
- 512 Flintwood Dr NE
- 2635 Beckwith Trail SE Unit 6
- 2650 Beckwith Trail SE
- 2670 Beckwith Trail SE
- 2650 Arrow Wood Dr NE
- 2621 Beckwith Trail SE
- 536 Flintwood Dr NE
- 2632 Arrow Wood Dr NE Unit 6
- 2690 Arrow Wood Dr NE
- 2611 Beckwith Trail SE
- 2640 Beckwith Trail SE Unit 6
- 2773 Lawrence Mill Run
- 2775 Lawrence Mill Run Unit 2
- 2771 Lawrence Mill Run Unit 2
- 2777 Lawrence Mill Run Unit II